Culture and Commerce
Japan's older consumers are not a family segment any more.
Written by Kaito Yoshizumi
- Published
- Last checked
- Reading time
- 11 minutes

Direct answer
The easiest way to picture Japan's older consumer is as one half of a couple. The stronger reading of the evidence is more divided. A Tokyo-area attitude survey found that older respondents increasingly prefer to act alone, while a national household survey found that one-person households containing someone aged 65 or over rose to 32.7 percent in 2024. The two sources do not measure the same thing, and they do not cover the same geography. Their value is that they moved in the same direction.
An overseas team can miss that distinction without making an obvious mistake. A product designed around shared meals, joint decisions, or a couple's budget may still look like an older-market product. It is not automatically addressed to the older Japanese market. The first task is to separate the older couple from the older person who shops, decides, and lives alone.
The familiar pitch: sell to the Japanese family
The familiar pitch starts with the household. Older people are treated as part of a family unit, so the offer is framed around the couple or around the relatives who are expected to influence the purchase. This is a convenient unit for planning because it turns an individual decision into a stable domestic story.
The data does not make that story impossible. It makes the unit less safe to assume. A market can contain family ties while also containing more people who want their own time, their own outings, and their own purchasing decisions. Treating family connection as evidence of joint consumption collapses two different questions.
The harder question is not whether older people still have families. It is whether the family is the right operating unit for the product. The evidence below suggests that an overseas team should ask that question before it sizes the opportunity.
What forty years of the same questions show
Hakuhodo has surveyed Japanese people aged 60 to 74 every ten years since 1986, with the 2026 wave reporting the forty-year change. This is an attitude series, not a national census of older people. The 2026 wave covered the area within 40km of central Tokyo, drew 700 men and women aged 60 to 74 between 14 January and 13 February 2026, and used leave-and-collect self-completion. The 1986 wave drew 1,650 respondents; the 1996, 2006, and 2016 waves drew 700 each.
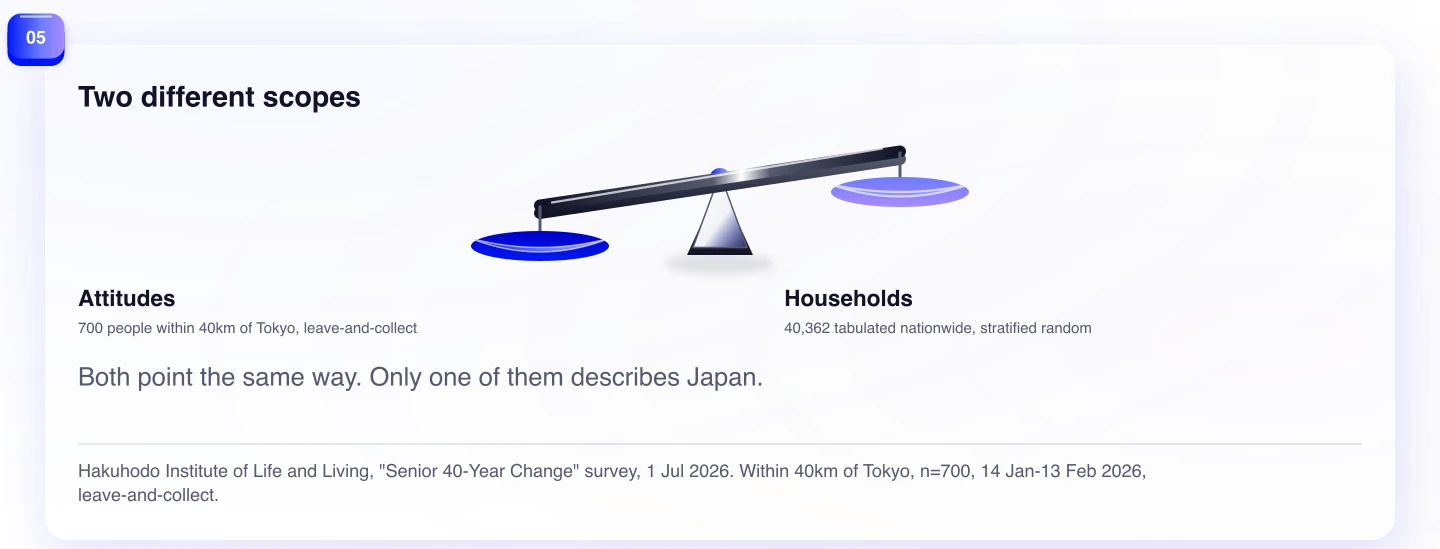
That scope matters. The survey can show how answers changed in a metropolitan sample over time. It cannot justify the sentence “older Japanese people now prefer to be alone” as a national fact. Its claim is narrower, and therefore more useful: within the Tokyo-area sample, the preference for solitary action became much more visible.
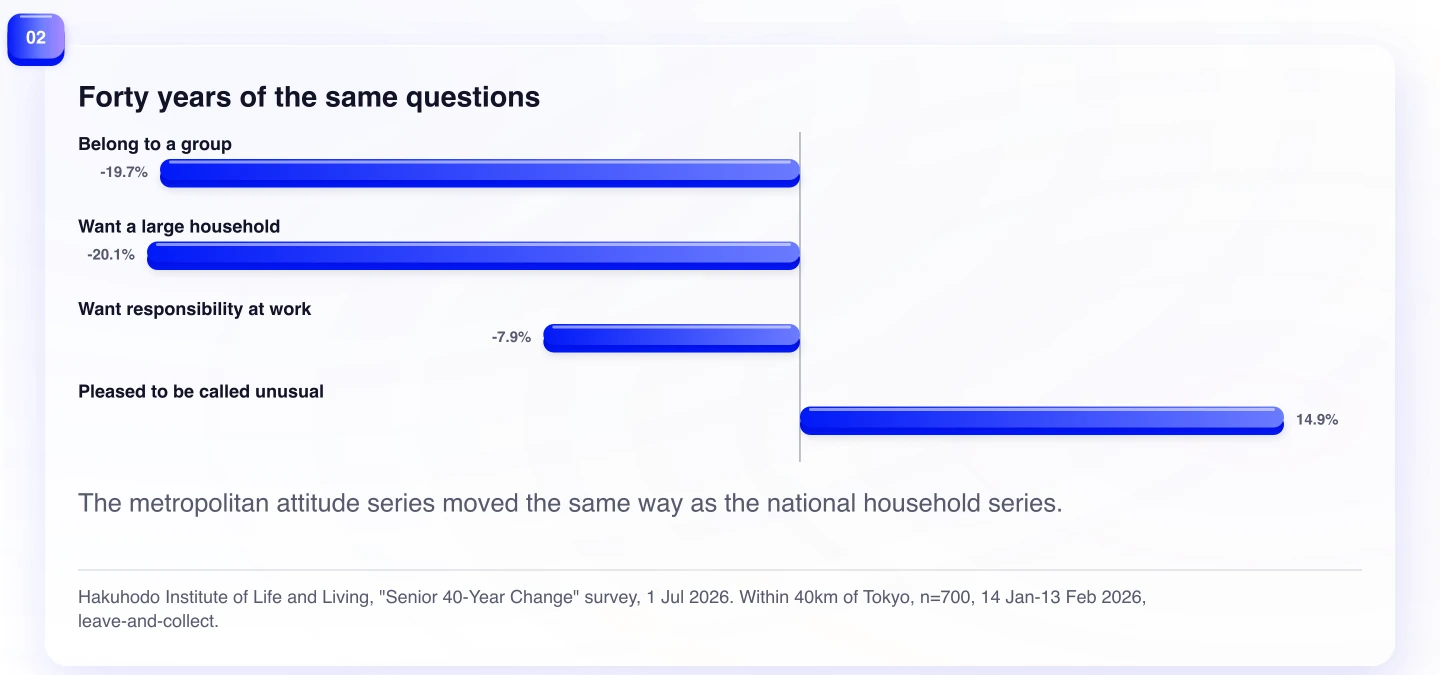
Across the forty-year comparison, the share saying they belong to a group fell by 19.7 points. The share wanting to live in a large household fell by 20.1 points. Those are attitudes about belonging and household preference, not counts of who currently lives alone.
The clearest answer is behavioral in wording but still belongs to the attitude survey. In the 2026 wave, 66.4 percent — two in three respondents — said they would rather act alone than with companions. Another 48.6 percent said they wanted to go to a cafe or similar place alone, about three times the level recorded forty years earlier. The pattern is not a rejection of other people. It is a stronger claim on the right to do ordinary things without organizing around companions.
The series also contains a quieter change in meaning. Over thirty years, the share finding purpose in being with family fell by 9.0 points. Over forty years, the share wanting a position of responsibility at work fell by 7.9 points, while the share pleased to be told they are unusual rose by 14.9 points. These results do not say that older people stopped valuing family or work. They say that the Tokyo-area respondents became less attached to some established sources of purpose and more comfortable with a distinct self-image.
The household data moved with the attitudes
The national evidence comes from a different instrument. The Comprehensive Survey of Living Conditions sampled 61,229 households through stratified random selection from 2020 census districts, then tabulated 40,362 households after fieldwork on 6 June 2024. It is a national household statistic, not a continuation of Hakuhodo's metropolitan attitude sample.
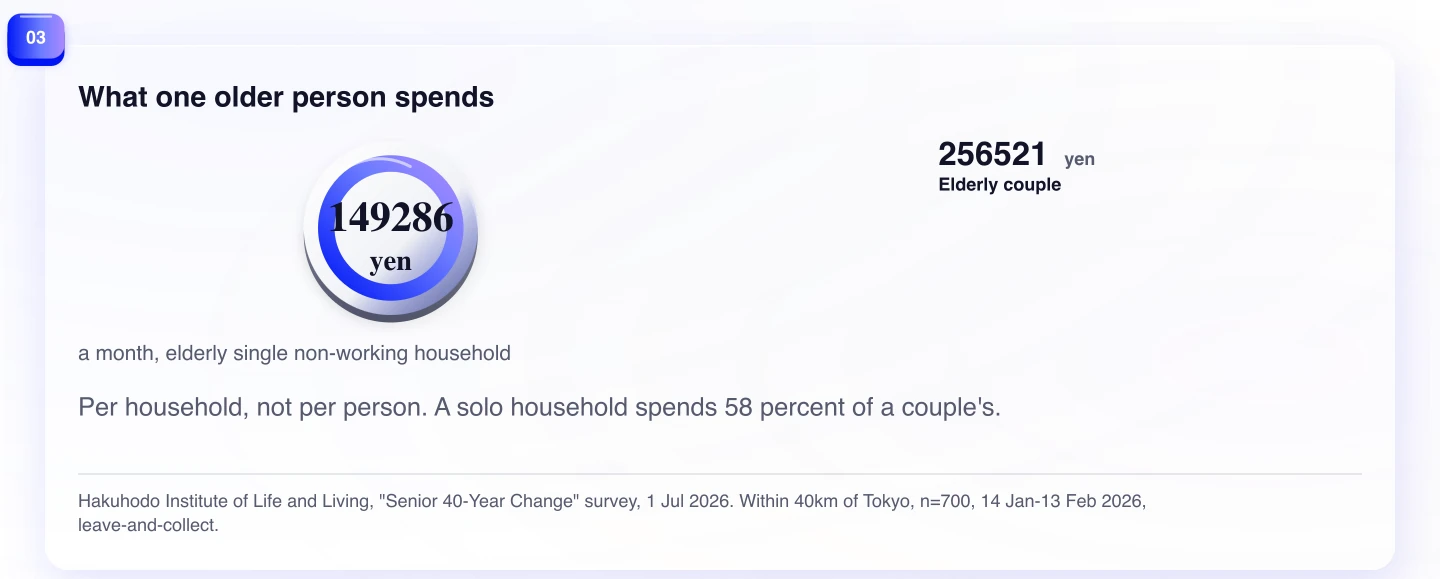
Among households containing someone aged 65 or over, one-person households rose from 13.1 percent in 1986 to 32.7 percent in 2024. In absolute terms, the count rose from 1.281 million such households in 1986 to 9.031 million in 2024. In 2024, those households represented 16.5 percent of all Japanese households.
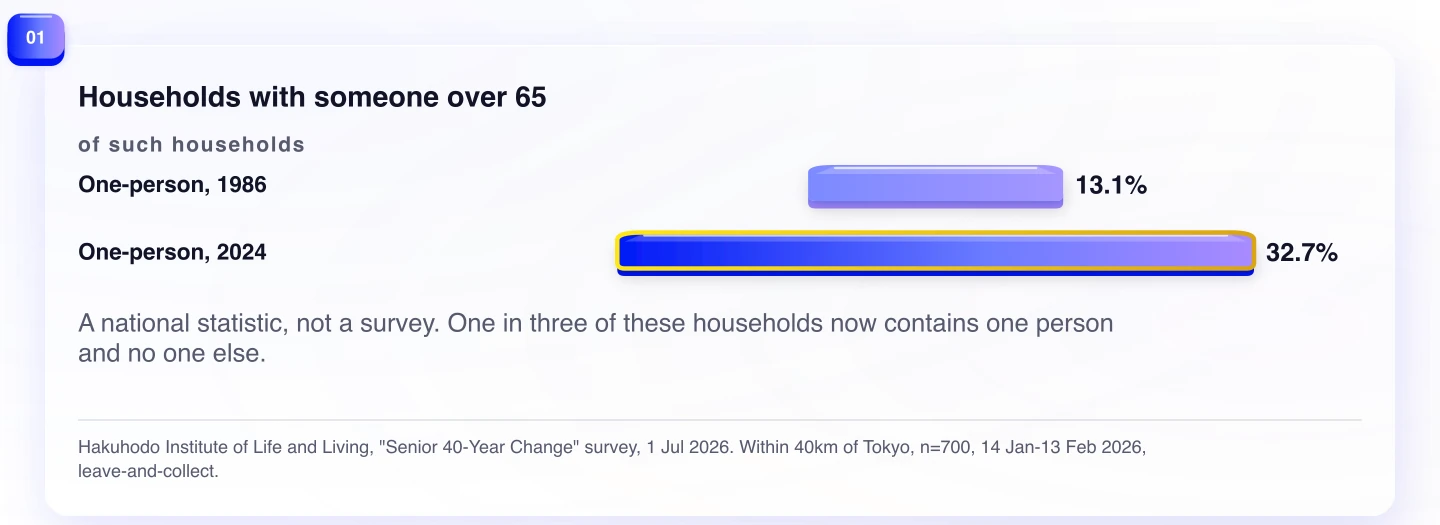
That is the article's central comparison. The Tokyo-area survey records a growing preference for solitary action. The national household statistic records a much larger share of older-containing households with one person. Neither proves that one caused the other. Together they make the family unit a poor default for market sizing.
The scale is easy to lose in a percentage. Nine million households are not a niche defined by a handful of unusual consumers. They are also not proof that every older person lives alone. The national statistic counts households containing someone aged 65 or over; it does not say that every person in those households is 65 or over, nor does it describe the reason the household formed.
What a solo household spends
The spending comparison adds a commercial consequence. The 2024 Family Income and Expenditure Survey is a continuous monthly survey of about 9,000 households across 168 municipalities, selected by three-stage stratified sampling and weighted to the Labour Force Survey's household distribution. The figures here are household-level results, not per-person budgets.
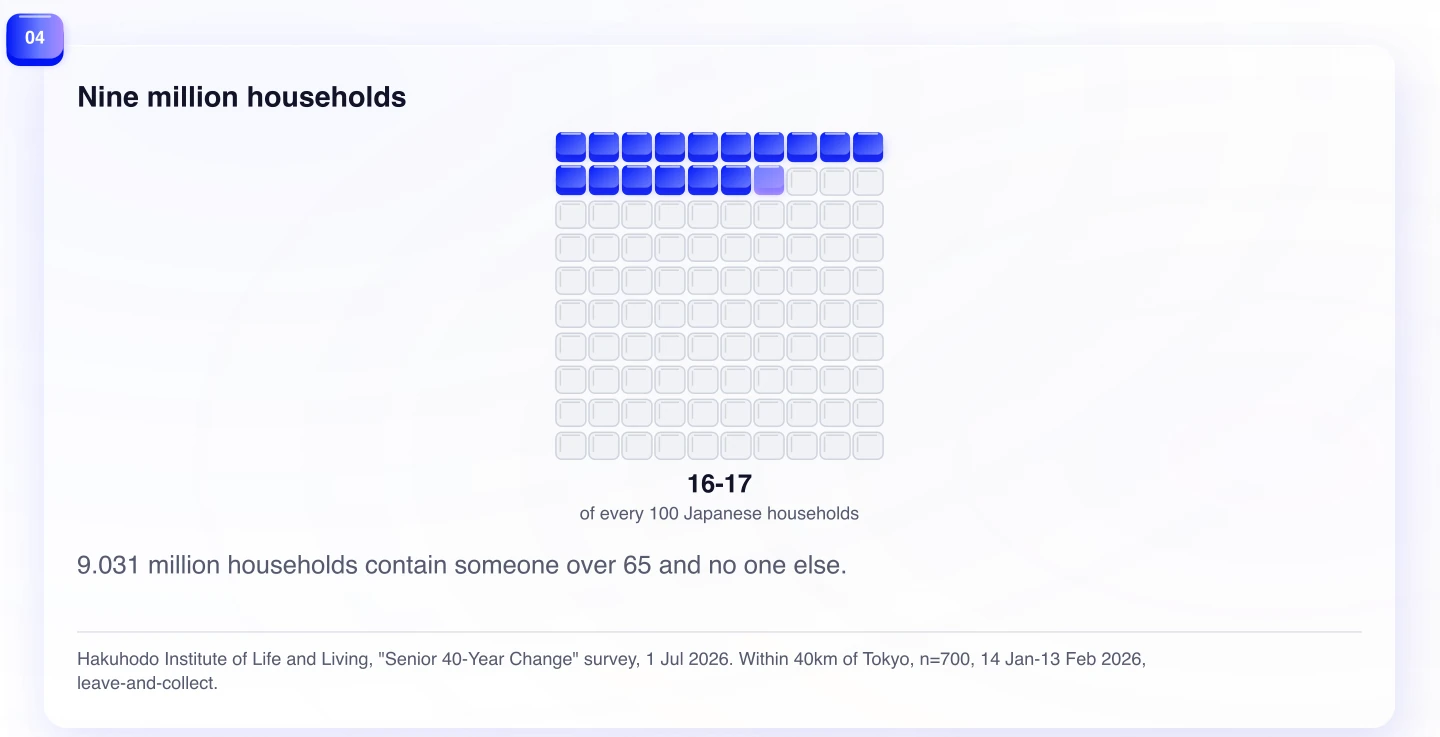
Monthly consumption expenditure was 149,286 yen for an elderly single non-working household and 256,521 yen for an elderly couple non-working household in 2024. The solo household therefore spent 58 percent of the couple's amount. That does not turn the solo household into a smaller couple. It changes the arithmetic of a purchase, the number of people who must agree, and the amount of consumption that can be shared across one decision.
The commercial implication is not that solo households want every product in a smaller format. The evidence does not measure product preferences at that level. It does support a more disciplined test: if the offer assumes two users, two sets of needs, or a shared budget, ask what happens when one person has to make the decision and absorb the cost.
The same test applies to service design. A couple-oriented offer often assumes that one person can compensate for another person's absence, memory, mobility, or time. A solo customer cannot make that assumption on the household's behalf. The offer may need clearer instructions, smaller decision steps, or a way to request help without turning help into a requirement. These are design questions, not findings that either survey measured directly.
Preference is not the same as circumstance
The strongest objection is straightforward. Preferring to act alone is not the same as living alone. Many one-person elderly households may have formed through bereavement rather than choice. A preference and a circumstance can point in the same direction for different reasons, and a company that treats the household statistic as evidence of consumer psychology could design for a motive the data never measured.
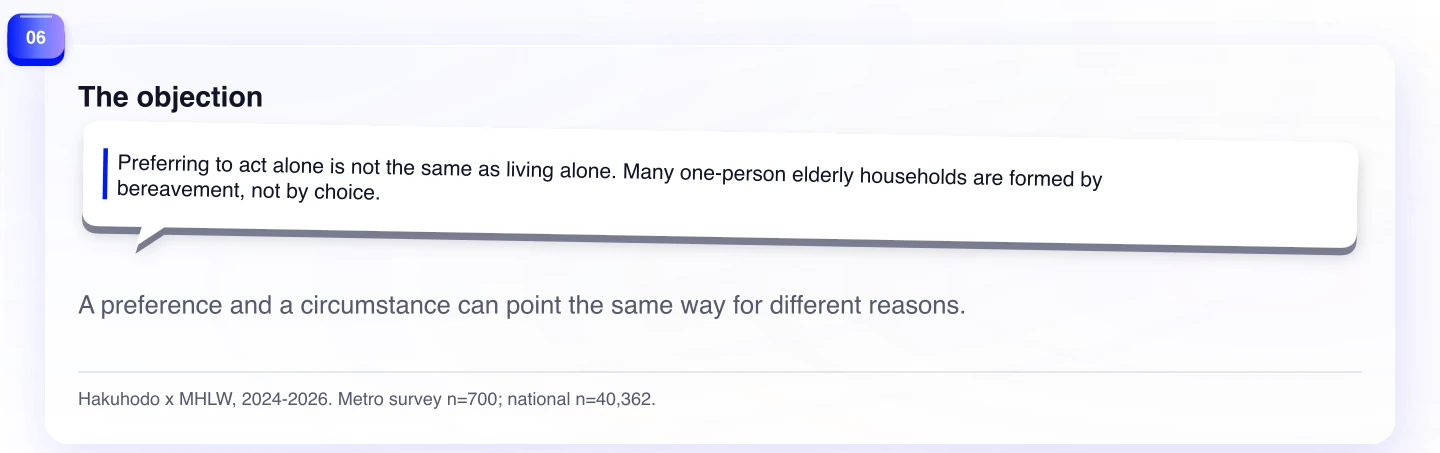
That objection should change the language and the product test. It should not restore the couple as the default. The Tokyo-area survey is about attitudes; the national survey is about living arrangements. Keeping the variables separate makes the combined signal stronger, because the argument no longer depends on pretending that they are interchangeable.
It also changes how an overseas team should speak to the market. “Independent older consumers” may sound like a lifestyle segment, while a one-person household can be a practical condition. The same service may need to support autonomy for one customer, lower the work of a solo decision, or make it easy to involve family without making family participation mandatory. Those are hypotheses to test, not facts established by the surveys.
The evidence does not show why the series moved. It shows that a metropolitan attitude series and a national household series both moved away from the assumption that the older market is naturally organized around a couple.
What remains unknown
Whether the preference causes the living arrangement, or the living arrangement teaches the preference, is not established by either source. The national household figures do not identify the emotional or practical route into a one-person household. The Tokyo-area attitude survey does not track whether a preference for solitary action becomes a purchase pattern.
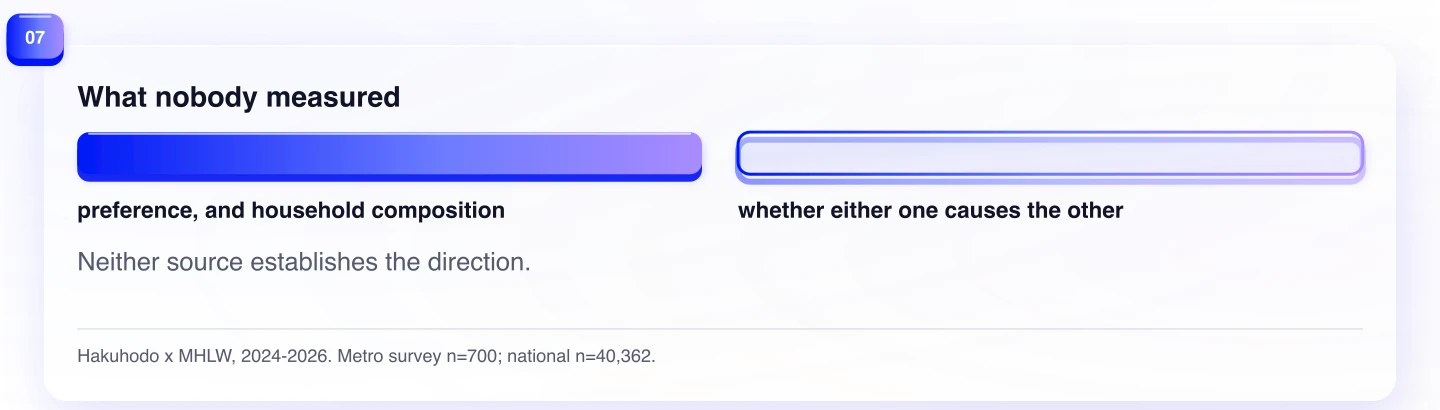
That unknown limits the claim. It does not tell a team to replace family marketing with a universal solo message. It tells the team to stop using the family as an untested proxy for the older customer.
What an overseas team should test
Start with the unit of action. Ask who notices the problem, who chooses the product, who pays, and who uses it. If those roles are assumed to sit inside a couple, separate them and test the assumption.
Then compare two versions of the offer: one built around a couple's shared use and one built around a single person's control, convenience, or pace. The available evidence does not tell you which version will win. It tells you that both deserve to be measured in a market where the solo household is no longer marginal.
Keep the geography visible in the research readout. Label the attitude result as a Tokyo-area finding and the household result as a national finding. Do not turn their agreement into a claim about all older people. The point is not to make the evidence sound larger than it is. The point is to notice that two differently scoped sources have made the same old segmentation harder to defend.
That discipline is useful beyond this category. When a local attitude series and a national behavior series point in the same direction, the result is a reason to refine the next test, not permission to erase the difference in coverage. The strongest brief will carry both labels all the way from research to creative, pricing, and measurement.
A product addressed to an older couple may still be right for some customers. It is not right by definition for the older market. Before building the next campaign around the family unit, size the 9.031 million national households separately and test what the solo customer is actually being asked to do.
Evidence
Sources
The works below support the article's factual claims and were rechecked on .
- 博報堂生活総合研究所「シニア40年変化」調査Hakuhodo Institute of Life and Living · July 1, 2026 · Accessed August 8, 2026
- 厚生労働省 国民生活基礎調査 2024年Ministry of Health, Labour and Welfare · June 6, 2024 · Accessed August 8, 2026
- 総務省統計局 家計調査 2024年Statistics Bureau of Japan · December 31, 2024 · Accessed August 8, 2026