Retail and Demand
Retail expansion is not a market-size estimate.
Written by Kaito Yoshizumi
- Published
- Last checked
- Reading time
- 9 minutes

Direct answer
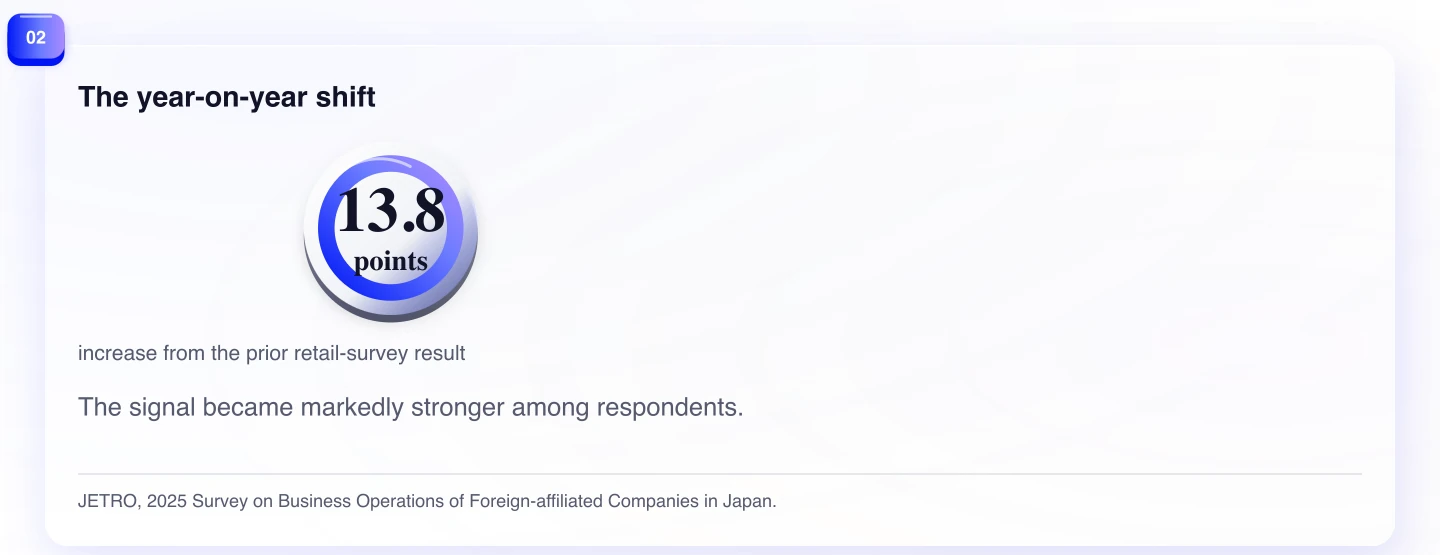
JETRO's 2025 survey contains a retail number worth noticing: 58.4 percent of its retail-trade respondents said they planned to strengthen and expand their Japan operations. That was 13.8 percentage points above the prior survey. It is a strong signal that a defined set of foreign-affiliated retailers is paying more attention to Japan. It is not a measure of Japan's retail-market size, a demand forecast, or a prediction that a particular brand will succeed.
That distinction is practical rather than pedantic. A team that reads the number as proof of demand may rush toward a store count, a location, or a channel before it has tested the customer and the economics. A team that reads it as a competitor-attention signal asks a better set of questions: who is looking, at which formats, in which places, for which customer job, and under which constraints?
The official data can help separate those jobs. JETRO asked companies about plans. METI's Current Survey of Commerce tracks sales activity as a supply-side view of goods consumption. The Statistics Bureau's household survey tracks household expenditure. None is a substitute for the others, and none answers a particular entrant's local business case. Taken together, they make the expansion headline more useful precisely because they stop it from becoming a market-size shortcut.
The 58.4 percent is a real signal with a real boundary
JETRO reports that 58.4 percent of retail-trade respondents planned to “strengthen and expand” their operations in Japan. The previous retail result was 44.6 percent, producing the reported 13.8-point rise. Within the industry's survey categories, retail had the highest share planning to strengthen and expand.
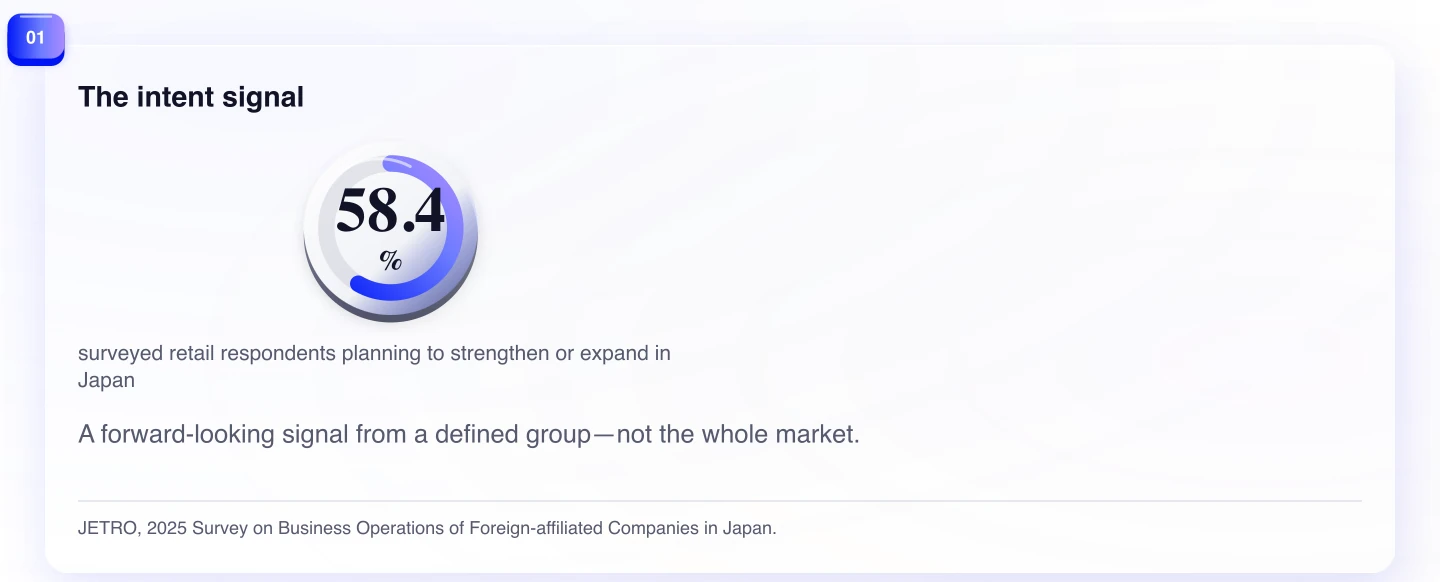
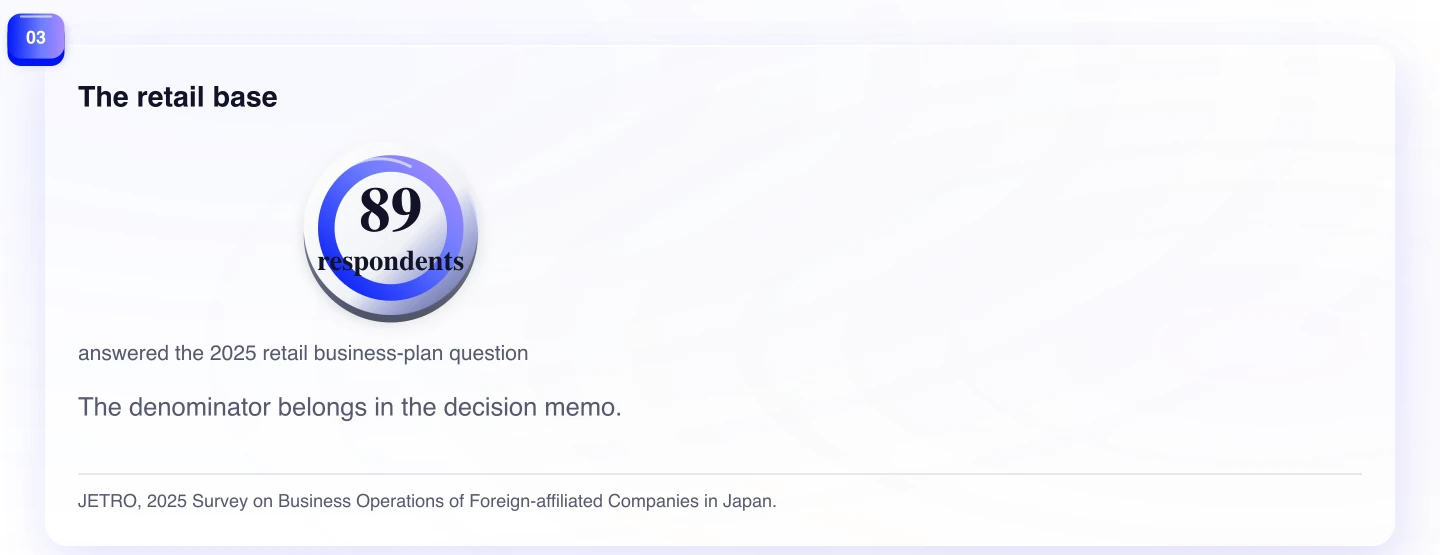
The right subject of that sentence is important: retail-trade respondents, not “Japanese retail” and not “all international brands.” The business-plan question had 89 retail respondents in 2025, compared with 74 in the previous survey. That is enough to make the movement notable. It is also small enough that the sample, classification, and wording deserve to stay visible every time the number is used in a board deck or entry memo.
JETRO targeted 7,698 foreign-affiliated companies and received 1,520 valid responses, a 19.7 percent valid response rate. Its definition includes companies with foreign ownership of 25 percent or more and companies identified as Japanese subsidiaries of foreign companies. The survey period ran from 25 September to 31 October 2025.
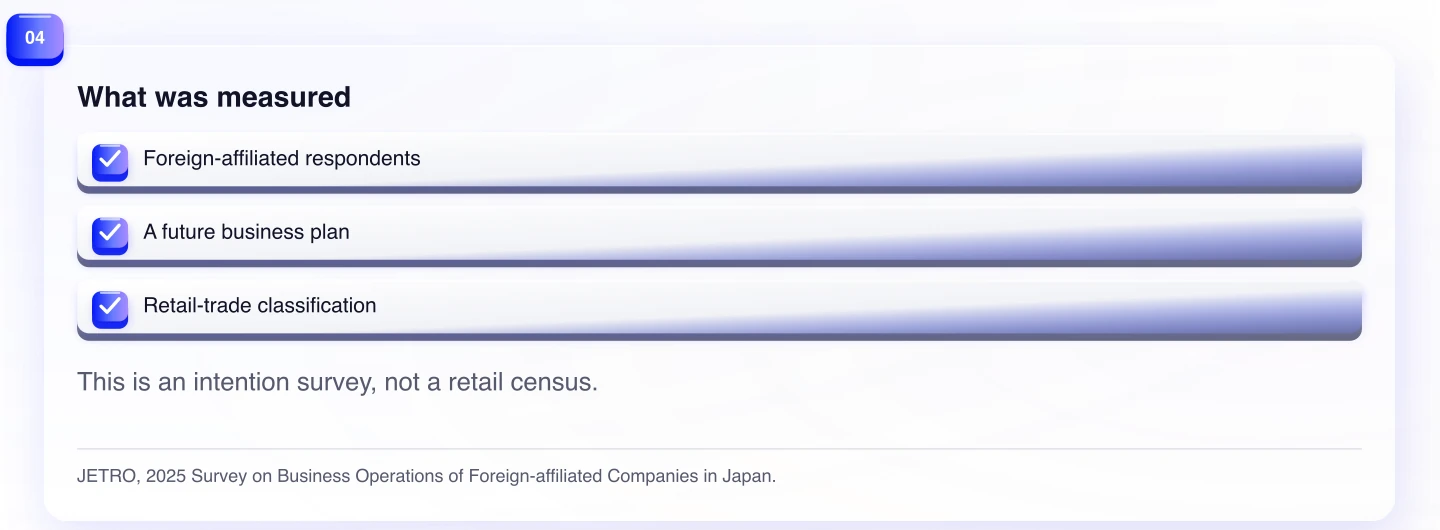
Those details do not weaken the finding. They define it. This is a report of declared plans among surveyed companies inside a specified foreign-affiliated population. It is not a census of retailers operating in Japan, an inventory of announced openings, or a measurement of consumer purchases.
Plans, sales activity, and household spending are different instruments
The most common misuse of an expansion survey is to make it carry a demand claim it did not measure. “More companies plan to expand” can coexist with slow demand growth, fast demand growth, crowded locations, under-served categories, or entirely different outcomes by format. Intent is upstream of execution and downstream of neither customer conversion nor profit.
METI's Current Survey of Commerce belongs in a different column of the evidence file. METI describes it as a supply-side indicator for observing consumption of goods through commercial sales activity. That makes it useful for tracking the sales environment by industry and format. It does not tell us that 58.4 percent of foreign-affiliated retail respondents will open stores, nor does it identify the consumer segment those firms expect to win.
The Statistics Bureau offers another lens. Its 2025 yearly average for two-or-more-person households put monthly consumption expenditure at 314,001 yen: up 4.6 percent in nominal terms and 0.9 percent in real terms from the prior year. This is valuable context for purchasing power and household consumption, but it is not a retail-market total and it is not a foreign-company survey.
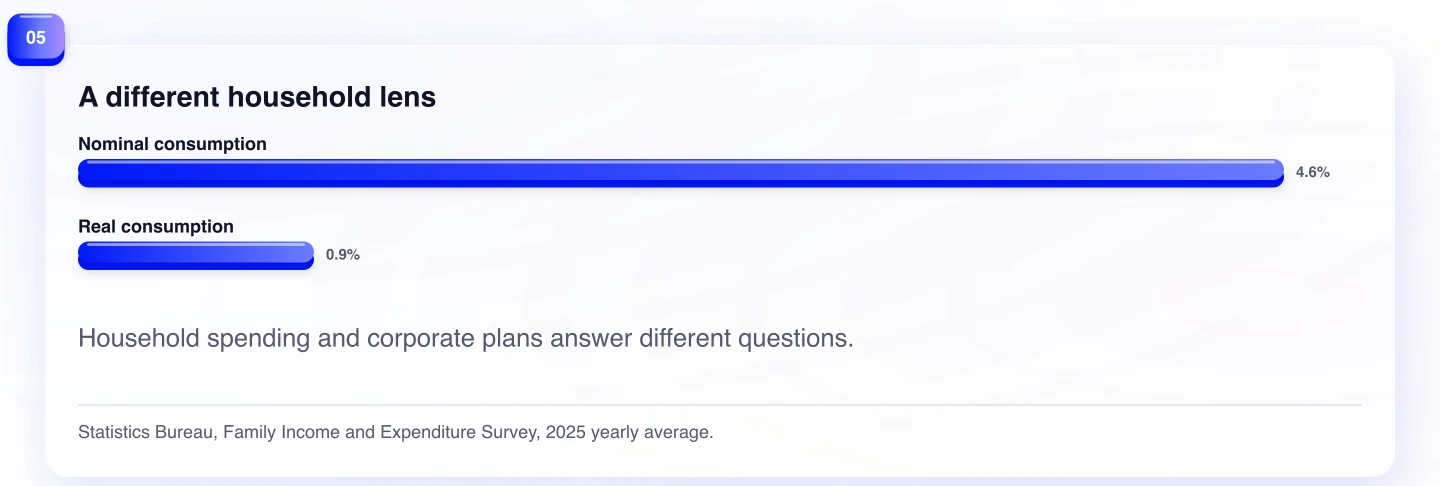
The figures should not be mashed into an invented score. A retail plan is a respondent's stated strategy. A commercial-sales series is a supply-side measure. A household-expenditure series follows a defined household population and expenditure framework. Their differing denominators are a feature of the evidence, not a problem to hide with a composite chart.
For a market-entry team, the central question is therefore not “does 58.4 percent prove demand?” It is “what might more competitor attention change before we enter?” In a promising category, it may make speed, site access, partner availability, hiring, distribution slots, and customer acquisition more expensive or more contested. In a weak category, it may simply show that a peer group is optimistic. Local data decides which interpretation survives.
Treat the number as a strategic signal
Strategic intent can be useful early in a decision. It can tell a team that Japan is back on the planning agenda for a peer set. That may justify a deeper competitor scan: monitor local entities, channel partnerships, trademark activity, hiring, distributor conversations, retail-media presence, and public opening announcements. It may also justify a more careful hypothesis about timing. If several credible peers seek the same department-store floor, mall zone, marketplace visibility, or bilingual staff pool, delay has an opportunity cost even before the market-size case is complete.
But a signal is not a command. The survey does not say which retail formats respondents intend to use, how much capital they will commit, which prefectures they prefer, which products will lead, or when a plan will become a transaction. It also does not report whether a stated plan later met its sales, margin, replenishment, or retention target.
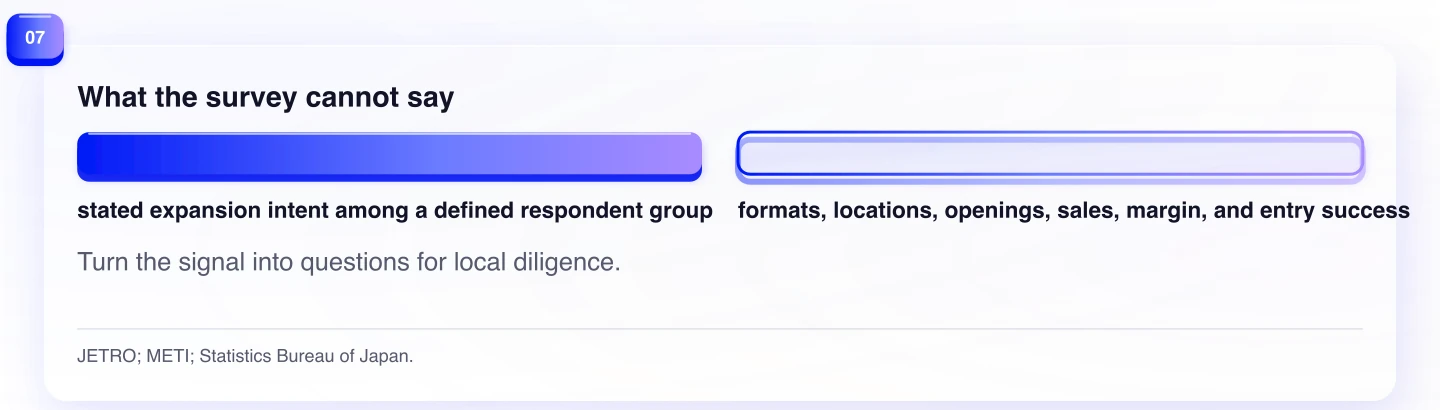
This is where a market-size estimate must be built from its own evidence. Define the customer. Size the reachable demand rather than a national category headline. Identify the price and basket that the concept needs. Test whether consumers can discover, understand, buy, receive, and reorder the offer. Include rents, fit-out, staffing, returns, customer service, import and compliance costs, inventory turns, channel fees, and the time it takes to earn repeat demand.
The survey can improve that work by forcing sharper competitor questions. It cannot complete the work for you.
The counterargument is partly right
There is a reasonable objection: if more foreign-affiliated retailers say they intend to expand, that may itself be evidence of attractive demand. Companies do have proprietary research, global brand data, partner conversations, and accumulated operating experience. Dismissing their intentions as meaningless would be a mistake.
The correction is about scope. The result is evidence that this respondent group sees reasons to consider expansion. It is not evidence that every respondent has the same reason, that their intelligence is correct, or that the aggregate plans will be executed. It cannot disclose what is private inside the plan: the location model, expected payback, local channel mix, parent-company capital, currency assumptions, or risk tolerance.
This is why intent data is often more valuable as a relative signal than as an absolute number. The 13.8-point rise says retail respondents became more expansion-oriented compared with the previous survey. It does not say Japan's retail market grew by 13.8 percent, nor that a new entrant has a 58.4 percent chance of a good outcome.
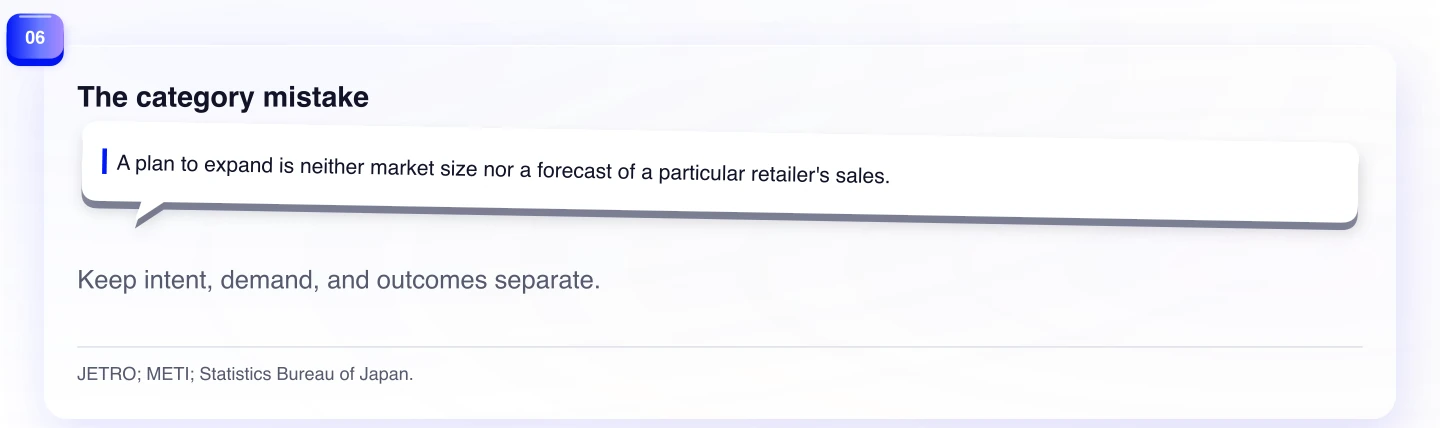
The distinction protects against two opposite errors. The first is false confidence: “peers are moving, so the customer must be there.” The second is false dismissal: “it is only a survey, so it tells us nothing.” A bounded signal can be material without becoming a forecast.
Build a decision that can disagree with the headline
Use the JETRO result as one input to an entry dashboard, not as the dashboard. Start with a statement that can be falsified: for example, a specified customer segment will buy a defined assortment at a target price through a chosen channel, often enough to cover local costs within a stated time. Then collect evidence that can prove or disprove it.
At minimum, separate five lines of evidence. First, customer demand: interviews, search behavior, traffic, trial conversion, baskets, repeat purchase, and reasons for non-purchase. Second, market access: where customers discover the offer, which local partners or platforms control access, and what it costs to appear. Third, operating feasibility: inventory, language support, payments, returns, service, compliance, and staffing. Fourth, economics: gross margin, channel cost, fixed costs, working capital, and payback. Fifth, competitor movement: the very attention signal that JETRO provides, corroborated by observable local activity.
This structure makes room for the number without asking it to impersonate a market-size estimate. If the competitive signal grows while the local demand test fails, do not enter just because peers may be planning. If local demand is strong and the competitive signal is rising, move with a clearer view of the constraints that will tighten. If neither is persuasive, keep the decision reversible.
There is a useful sequencing discipline here. Begin with the cheapest evidence that can change the decision: interviews with the defined customer, a search and discovery audit, channel conversations, small paid or organic demand tests, and a realistic landed-price comparison. Only then move to the costs that make a wrong answer expensive: inventory commitments, a lease, fit-out, local headcount, or an exclusive partner arrangement. Competitor intent can change the urgency of those tests. It cannot make the tests unnecessary.
Teams should also record what would change their mind. A planned expansion might be a signal of high-quality competitor research, or it might be a response to a global directive, a temporary window in real estate, a distribution partner's proposal, or an internal target. The observable facts that discriminate between those stories are concrete: whether peers actually hire, secure a channel, launch an assortment, sustain stock, or return for a second site. Treat public movement as corroboration, not as a substitute for customer evidence.
This approach is especially useful for brands that have succeeded elsewhere. A familiar global category can make a national expansion statistic feel sufficient. Japan entry still requires a local proposition: who buys, why this version is worth choosing, what source of trust makes the offer credible, and what operational frictions reduce repeat purchase. The market can be large and still be wrong for a particular assortment, price architecture, or route to market.
JETRO's 58.4 percent is worth putting on the page. Put its boundary beside it. It describes a declared intention among 89 surveyed foreign-affiliated retail respondents. The right response is not to convert that intention into a national demand claim. It is to use the signal to ask a more disciplined local question, then let customer evidence and economics answer it.
Evidence
Sources
The works below support the article's factual claims and were rechecked on .
- 2025 Survey on Business Operations of Foreign-affiliated Companies in JapanJapan External Trade Organization · February 26, 2026 · Accessed August 10, 2026
- Current Survey of Commerce, December 2025 preliminary reportMinistry of Economy · January 30, 2026 · Accessed August 10, 2026
- Family Income and Expenditure Survey, 2025 yearly averageStatistics Bureau of Japan · February 6, 2026 · Accessed August 10, 2026