Economy and Entry
Japan's nominal growth is not proof of pricing power.
Written by Kaito Yoshizumi
- Published
- Last checked
- Reading time
- 10 minutes

Direct answer
Japan's 2025 household numbers can make a market look healthier than it feels. Consumption and income both rose in yen terms. Yet for workers' two-or-more-person households, real income fell. That is not a statistical footnote for an overseas entrant. It is the difference between a larger sales total and evidence that customers can absorb a higher price.
The useful question is not whether Japan spent more yen in 2025. It did, in several of the series. The harder question is what those yen bought, who was doing the spending, and whether the increase came from stronger demand or from a higher cost of living.
That distinction becomes urgent when a company sees early Japanese revenue rise. A dashboard will show a clean upward line. A planning meeting will be tempted to call it traction, pricing power, or permission to spend more on acquisition. Sometimes that reading will be right. National household data alone cannot establish it.
The dashboard can tell two stories
The Statistics Bureau's 2025 Family Income and Expenditure Survey reports a monthly average of 314,001 yen in consumption expenditure for two-or-more-person households. That was 4.6 percent higher than the year before in nominal terms and 0.9 percent higher after adjusting for prices. On its face, this is an encouraging result: household consumption did not simply collapse under inflation.
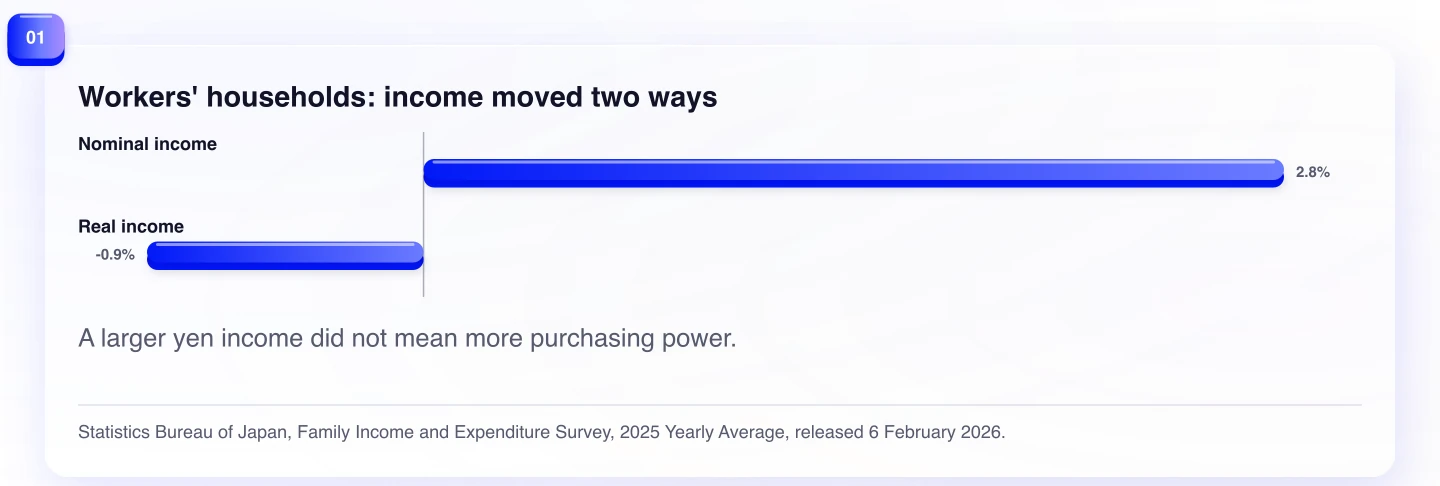
But the same release gives a different result for the income that workers' households had available to meet those costs. Monthly income for workers' two-or-more-person households averaged 653,901 yen, up 2.8 percent in nominal terms but down 0.9 percent in real terms. Their disposable income fell 1.7 percent in real terms.
Both statements can be true without cancelling one another. A household can spend more yen while the purchasing power of its income declines. It may reprioritize, draw on savings, reduce another category, or face costs it cannot easily avoid. National totals do not tell us which explanation applies to a particular family, much less to a buyer of a particular product.
There is another reason not to compress these figures into one headline. The survey reports several household populations: two-or-more-person households, workers' households, total households, and one-person households. They are not alternative labels for the same consumer. A conclusion that holds for one series may not hold for another.
For total households, real monthly consumption expenditure fell 0.1 percent in 2025, the third consecutive annual decline. For one-person households, it fell 1.5 percent, also the third consecutive decline. The nationally visible spending story is therefore mixed even before a company asks what happened inside its own category.
Prices are part of the sales number
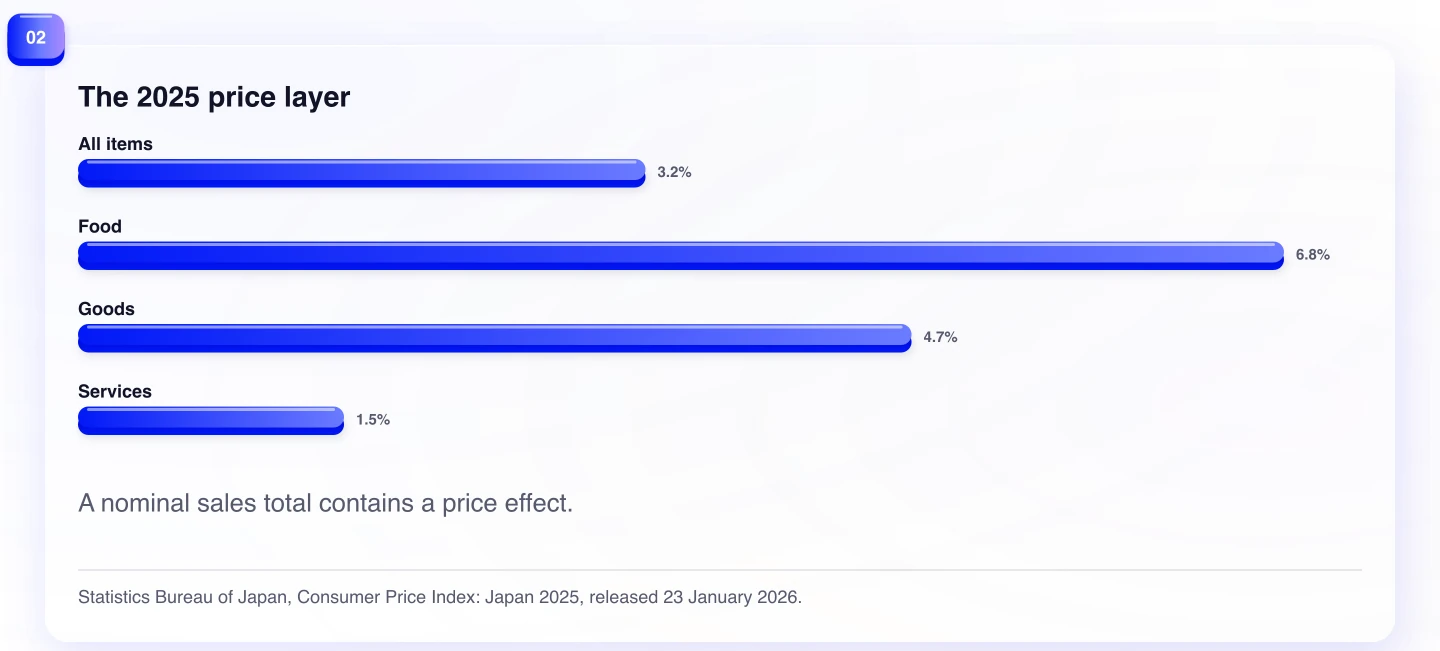
The Consumer Price Index supplies the missing context. Japan's all-items CPI rose 3.2 percent in 2025. Food rose 6.8 percent, goods rose 4.7 percent, and services rose 1.5 percent. A nominal sales total is partly a record of this higher price level.
This does not mean every price increase is fake growth. A company can raise price because its offer became more useful, more trusted, harder to replace, or better matched to a local need. Those are forms of pricing power. The error is using an aggregate nominal-spend increase as proof that they exist.
Think of the difference as a measurement problem. Revenue is price multiplied by quantity, then shaped by product mix, discounts, returns, and timing. National household expenditure is broader still: it includes categories that may be essential, discretionary, durable, recurring, or entirely unrelated to the entrant's offer. When food prices are rising rapidly, a larger household-spend number cannot tell a software, consumer-goods, or service company that customers now value its product more.
The obvious response is to look only at real expenditure. That helps, but it is not a final answer. A real national aggregate removes a general price effect; it does not measure the value a particular segment assigns to a new proposition. It also cannot tell a company whether its own price moved ahead of or behind the price of alternatives.
What households said they were feeling
The Bank of Japan's Opinion Survey adds a different kind of evidence. It is not a spending survey and it is not a price index. It asks adults living in Japan how they view their circumstances, prices, and planned spending. That makes it useful as a check on interpretation, not as a substitute for the official household accounts.
In the September 2025 survey, 94.8 percent of respondents said prices had risen over the previous year. Among respondents who said their household circumstances had become worse, 91.2 percent named higher prices as a reason. Among those whose spending had increased, 86.6 percent said the costs of consumer goods and services had risen.
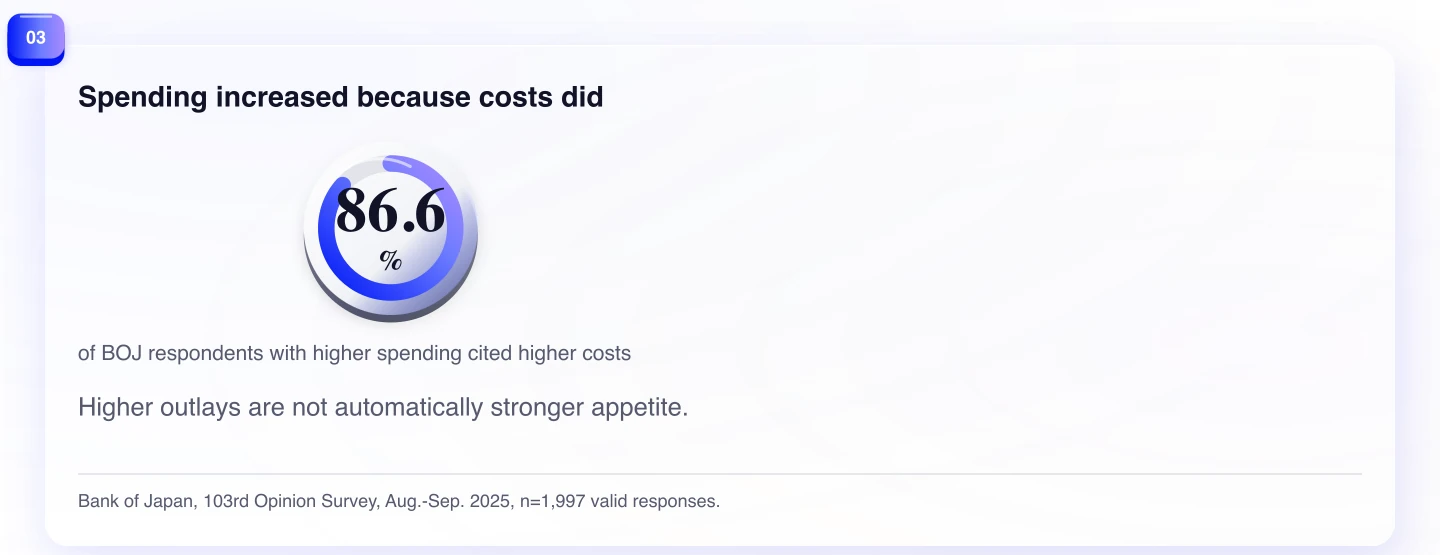
The last figure matters because it interrupts a seductive story: more spending does not necessarily mean more appetite. For many respondents reporting higher spending, higher costs were the explanation. The survey does not prove that people were cutting back everywhere else, nor does it measure what they bought. It shows that households themselves could experience an increase in outlays as cost pressure rather than prosperity.
The methods set the boundary. The September survey used stratified two-stage random sampling of people aged 20 or over living in Japan. It drew 4,000 people, received 1,997 valid responses, and ran from 1 August to 3 September 2025 by mail or internet, in Japanese. The Family Income and Expenditure Survey is a household-statistics program, not an opinion poll. Its annual summary is the appropriate source for reported income and expenditure; the BOJ survey is the appropriate source for what respondents said they perceived.
Nominal growth is not pricing power
Here is the interpretation the three sources support. Japan's 2025 data are consistent with a market in which yen-denominated activity can rise while real household resources remain under pressure. That is a warning against inference, not a claim that demand is absent.
For an entrant, visible spend growth has at least three possible readings. The first is price-led growth: customers are paying more for broadly similar baskets. The second is mix-led growth: a different set of purchases, channels, or customer groups is lifting the total. The third is demand-led growth: more customers, more units, or stronger retention are producing real commercial expansion. These can coexist. The national figures do not apportion them for your business.
That is why a Japanese launch plan should not convert a nominal market-growth statistic directly into a willingness-to-pay assumption. A premium product may sell well because it removes an important uncertainty. It may also struggle because a household has little room after everyday costs. Both outcomes are compatible with the macro picture.
The counterargument: some real spending did rise
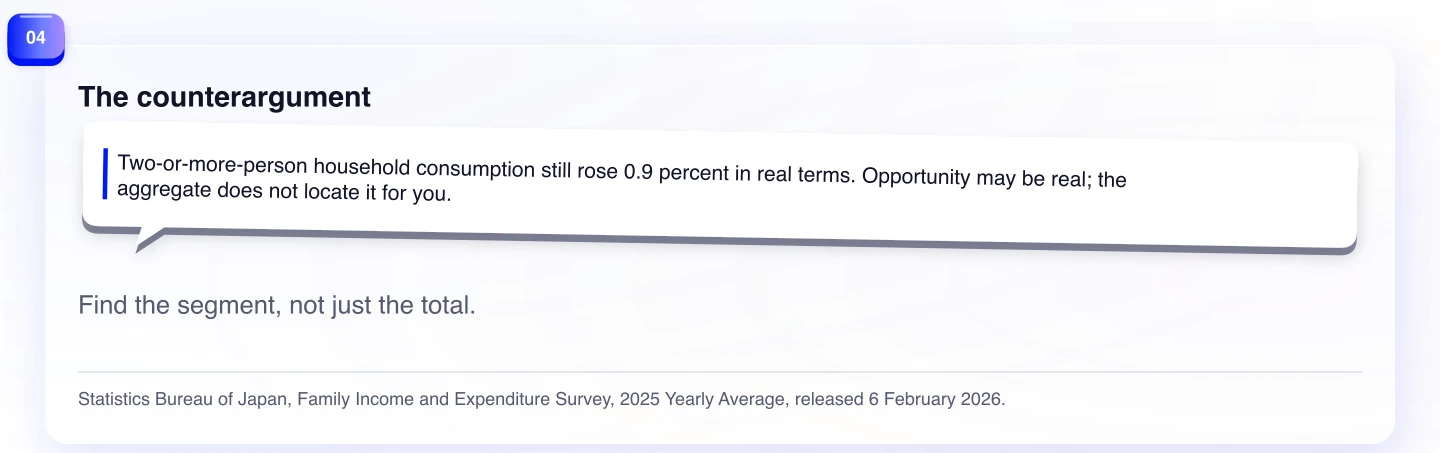
The cautious reading can be pushed too far. Two-or-more-person household consumption rose 0.9 percent in real terms in 2025, and workers' household consumption rose 2.7 percent in real terms. Several major expenditure categories also increased in real terms. It would be wrong to describe Japan as a single, uniformly retreating consumer.
This is the productive counterargument. It directs attention to differences rather than pessimism. A company may find a segment whose income, need, or purchase timing makes real growth possible. A category with a clear practical payoff can gain share even when the household budget is tight. A price increase can hold when the value is legible and alternatives are weak.
The counterargument still does not create a shortcut. It tells a team to identify where its growth comes from. A national real gain in one household series is a reason to look for opportunity, not a warrant to assume an untested price will be accepted.
What the data cannot establish
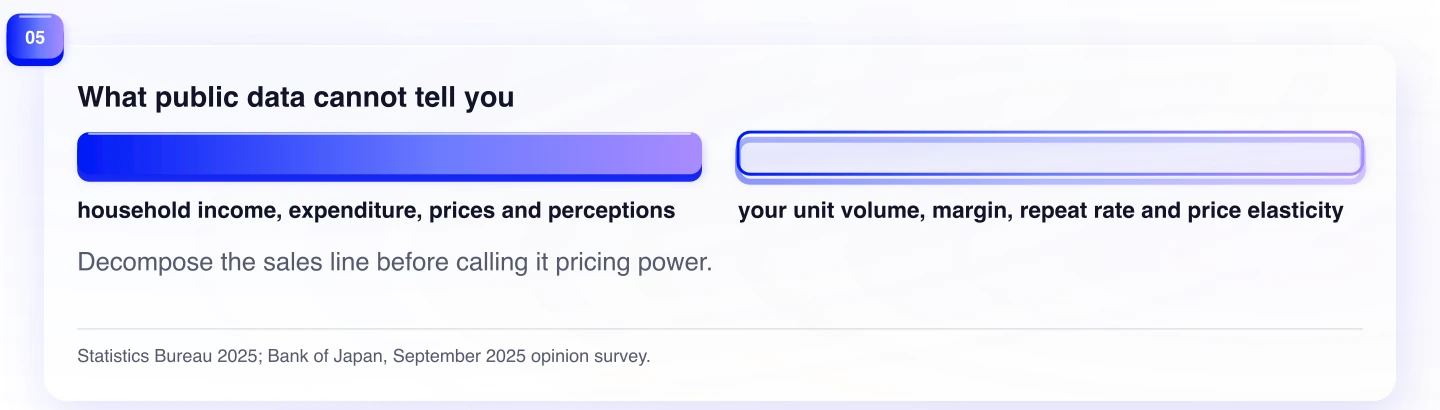
The public sources cannot reveal an entrant's unit volume, price elasticity, gross margin, repeat rate, or the reason a customer accepted a price. They do not identify whether a revenue increase came from a better product, inflation, a one-off promotion, a favorable channel mix, or a smaller base of customers buying more often.
They also do not tell us how price pressure lands across every income, region, or household type. The aggregate and survey results are signals for designing a test. They are not a substitute for cohort data, local customer interviews, or a properly controlled price experiment.
What an overseas entrant should test
Start by splitting the sales line into parts that can disagree. Track unit volume separately from average selling price. Split new customers from repeat customers. Check whether a mix shift toward a higher-priced plan or bundle explains the rise. Then look at contribution margin after local support, shipping, returns, payment costs, and acquisition costs—not just top-line yen revenue.
Next, test the value story before you test a broad price increase. For one segment, make the practical benefit and total cost unusually clear. For another, compare a lower-commitment entry point with the full offer. The purpose is not to discount reflexively. It is to learn whether the customer is responding to the offer or merely accommodating a market-wide rise in prices.
Finally, label the evidence correctly inside the company. “Household spending is up” is an observation. “Our customers will accept a higher price” is a hypothesis. Keeping those sentences apart makes the launch plan more demanding, but it also makes it more useful.
There are a few diagnostic traps to avoid. Do not use a competitor's nominal price increase as proof that its customers accepted the change; the public price may conceal discounting, churn, or a shift toward a different channel. Do not treat fewer complaints as proof of price acceptance if the support path has become harder to reach. And do not read a stable conversion rate without checking traffic quality and repeat behavior. Each measure can be useful. None carries the entire explanation on its own.
The same discipline makes internal debate clearer. Finance can ask whether the local unit is generating contribution after costs. Product can ask which uncertainty makes the offer worth its price. Marketing can ask which segment responds without a promotional crutch. Those are complementary questions. A national nominal-spend figure is context for them, not an answer.
Japan's 2025 numbers do not say that a foreign entrant cannot grow. They say that a sales increase in yen is an ambiguous signal. Before calling it pricing power, find the units, the margin, and the customer choice underneath it.
Evidence
Sources
The works below support the article's factual claims and were rechecked on .
- Family Income and Expenditure Survey: 2025 Yearly AverageStatistics Bureau of Japan · February 6, 2026 · Accessed August 10, 2026
- Consumer Price Index: Japan 2025Statistics Bureau of Japan · January 23, 2026 · Accessed August 10, 2026
- 103rd Opinion Survey on the General Public's Views and BehaviorBank of Japan · October 10, 2025 · Accessed August 10, 2026