Commerce and Infrastructure
Japan is cashless enough to matter. It is still a card market.
Written by Kaito Yoshizumi
- Published
- Last checked
- Reading time
- 10 minutes

Direct answer
Japan passed its cashless target. In 2024, cashless payments reached 42.8 percent of the value consumers paid, clearing the government's target of around 40 percent. The tempting conclusion is that the market has become a contest among cards, QR codes, transit wallets, and whatever comes next. The value data tells a more concentrated story: credit cards carried 82.9 percent of cashless payment value.
That does not make the other methods unimportant. It makes the planning problem more exact. An overseas team should stop asking whether Japan is cashless enough for its checkout. It should ask whether its checkout works in a cashless market whose main settlement rail is still the card.
The familiar pitch: Japan has finally gone cashless
For years, Japan was described through the image of cash: notes at the counter, coins in a tray, and a visitor unsure whether a small merchant could take a card. That image had some truth. It also became an excuse for shallow market planning. A company could see cash in the street, infer a general resistance to digital payments, and delay the local work of accepting the methods people already used.
METI's 2024 result makes that delay harder to defend. The ministry calculated a cashless payment ratio of 42.8 percent, equivalent to 141.0 trillion yen. That exceeded the government's earlier objective of raising the ratio to around 40 percent by 2025.
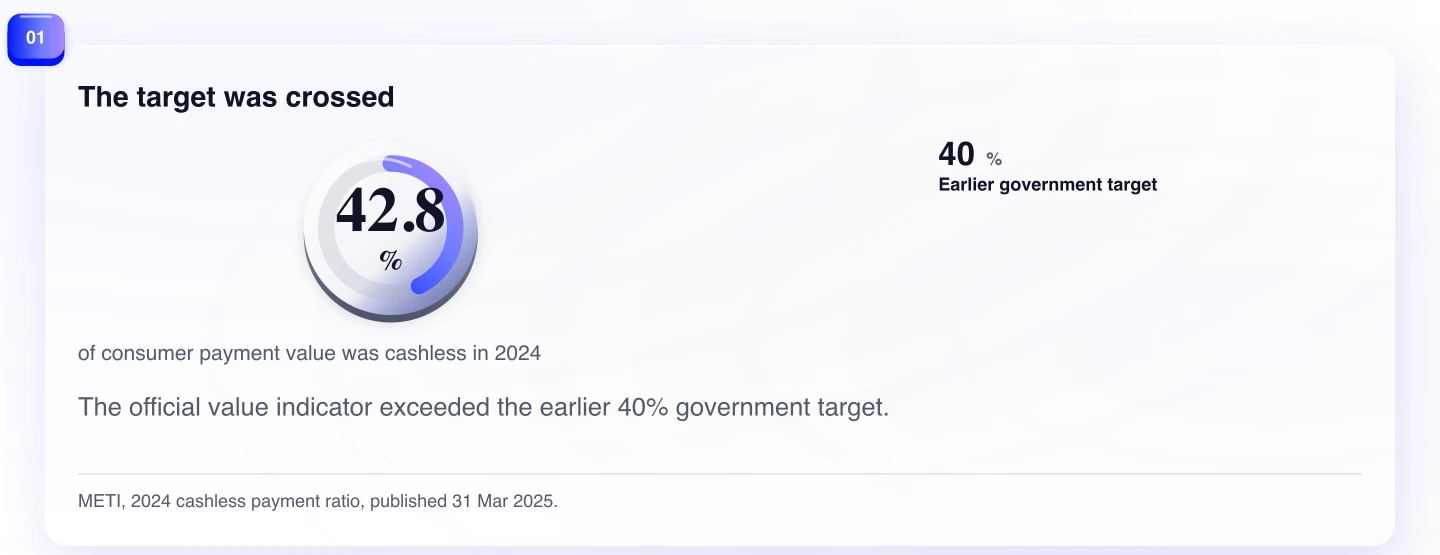
The result matters, but the label needs care. The ratio is an official value indicator. METI calculates it from calendar-year data after the underlying sources are released, combining payment data and nominal national accounts to show progress in cashless dissemination. It is not a count of how many times people tapped, scanned, or paid online. It is not a survey asking which method buyers prefer.
That difference is where the useful interpretation begins. A market can have many visible ways to pay while sending most of its value through one of them.
What 42.8 percent actually measures
The numerator behind the 42.8 percent is 141.0 trillion yen of cashless payment value. METI breaks it into four methods. Credit cards represented 116.9 trillion yen, or 82.9 percent of the total. Code payments represented 13.5 trillion yen, or 9.6 percent. Electronic money accounted for 6.2 trillion yen, or 4.4 percent, while debit cards accounted for 4.4 trillion yen, or 3.1 percent.
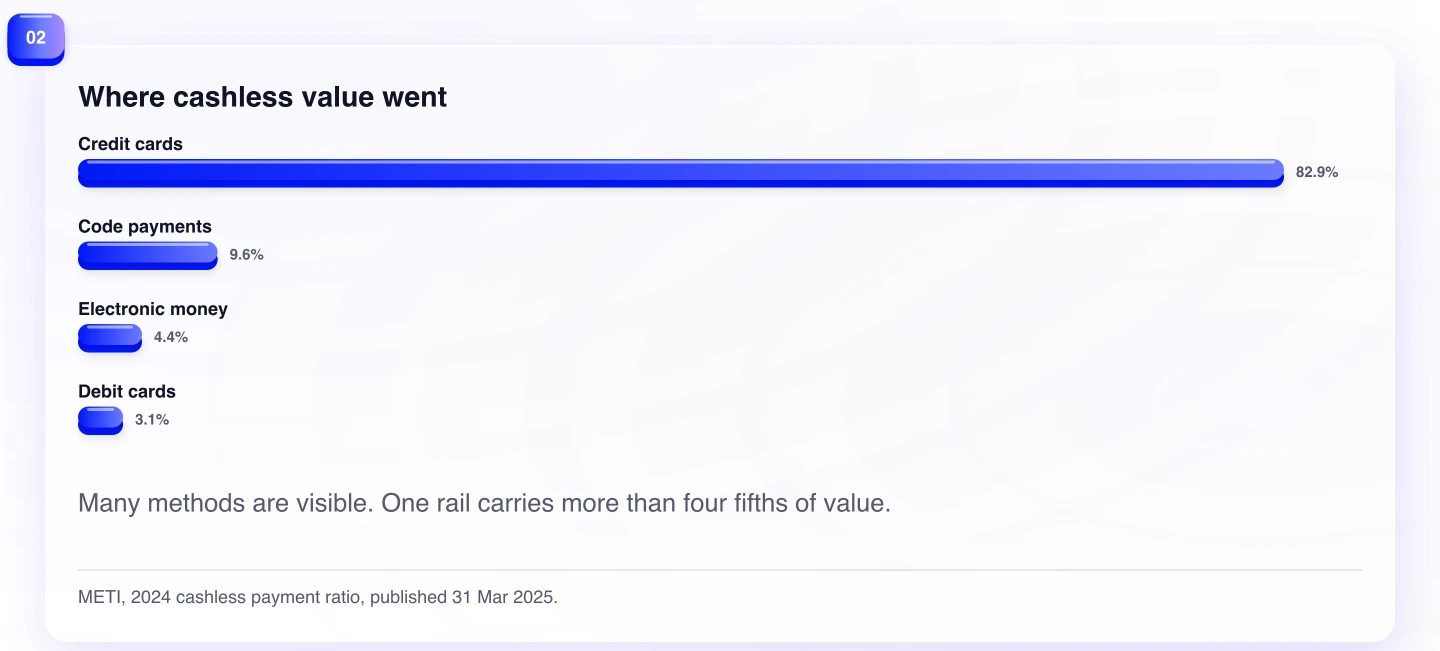
The visual hierarchy many foreign teams encounter in Japan can therefore be misleading. A QR code can be highly visible at a counter. A transit wallet can be woven into a commuter's day. A local app can be central to a campaign. None of those observations tells us how much payment value moves through that method across the country.
Cards do not merely lead the table. They account for more than four fifths of the value METI counted as cashless in 2024. Calling Japan a cashless market is accurate. Calling it a balanced multi-rail market would be less accurate.
This is not a reason to romanticize plastic. The card may be stored in a phone, used online, linked to another service, or kept out of view altogether. The operational point is narrower: if a payment journey fails at card acceptance, authorization, billing explanation, or recovery after a failed charge, the business is failing on the rail that carried most of the measured value.
A cashless market can still have one dominant rail
The 2023 result makes the concentration easier to see as a pattern rather than a single-year snapshot. That year, the cashless ratio was 39.3 percent and total cashless value was 126.7 trillion yen. Credit cards accounted for 83.5 percent of the cashless total, code payments for 8.6 percent, electronic money for 5.1 percent, and debit cards for 2.9 percent.
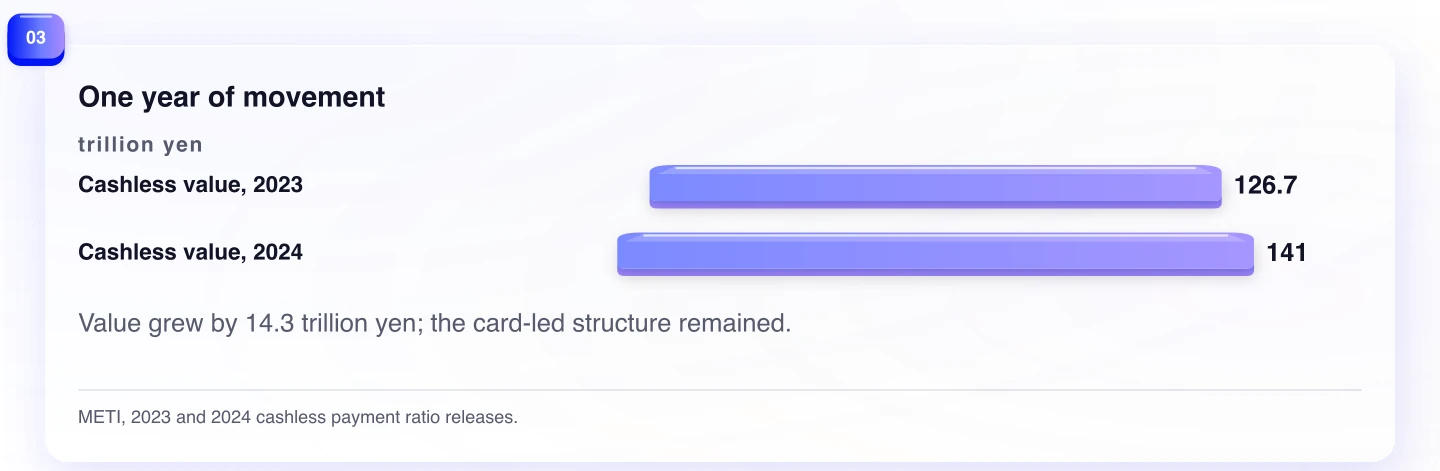
From 2023 to 2024, cashless payment value rose by 14.3 trillion yen. The credit-card share fell by 0.6 percentage points, and the code-payment share rose by 1.0 point. That is movement. It is not yet a rearrangement of the market's center of gravity.
The distinction protects against two opposite mistakes. The first is to plan as if cash still defines the entire market. The second is to see a rising code-payment share and assume that cards have become an optional legacy layer. Both miss the state the data actually describes: increasing non-cash value with continued card dominance.
For a foreign brand, the difference can appear in dull but consequential places. Does the local checkout accept cards in the way buyers expect? Is the card descriptor comprehensible? What does a customer see after an authorization fails? Is the refund path clear? Are recurring charges and cancellation terms unambiguous? A beautiful mobile payment button does not resolve those questions.
Daily use is plural; value is not evenly distributed
The Bank of Japan's March 2025 opinion survey gives the other half of the picture. It asked valid respondents which payment instruments other than cash they used daily, allowing more than one answer. Credit cards were selected by 73.2 percent. Barcode or QR payments were selected by 42.9 percent, direct debit by 34.3 percent, contactless electronic money by 30.8 percent, and debit cards by 5.0 percent. The share selecting cash only was 7.2 percent.
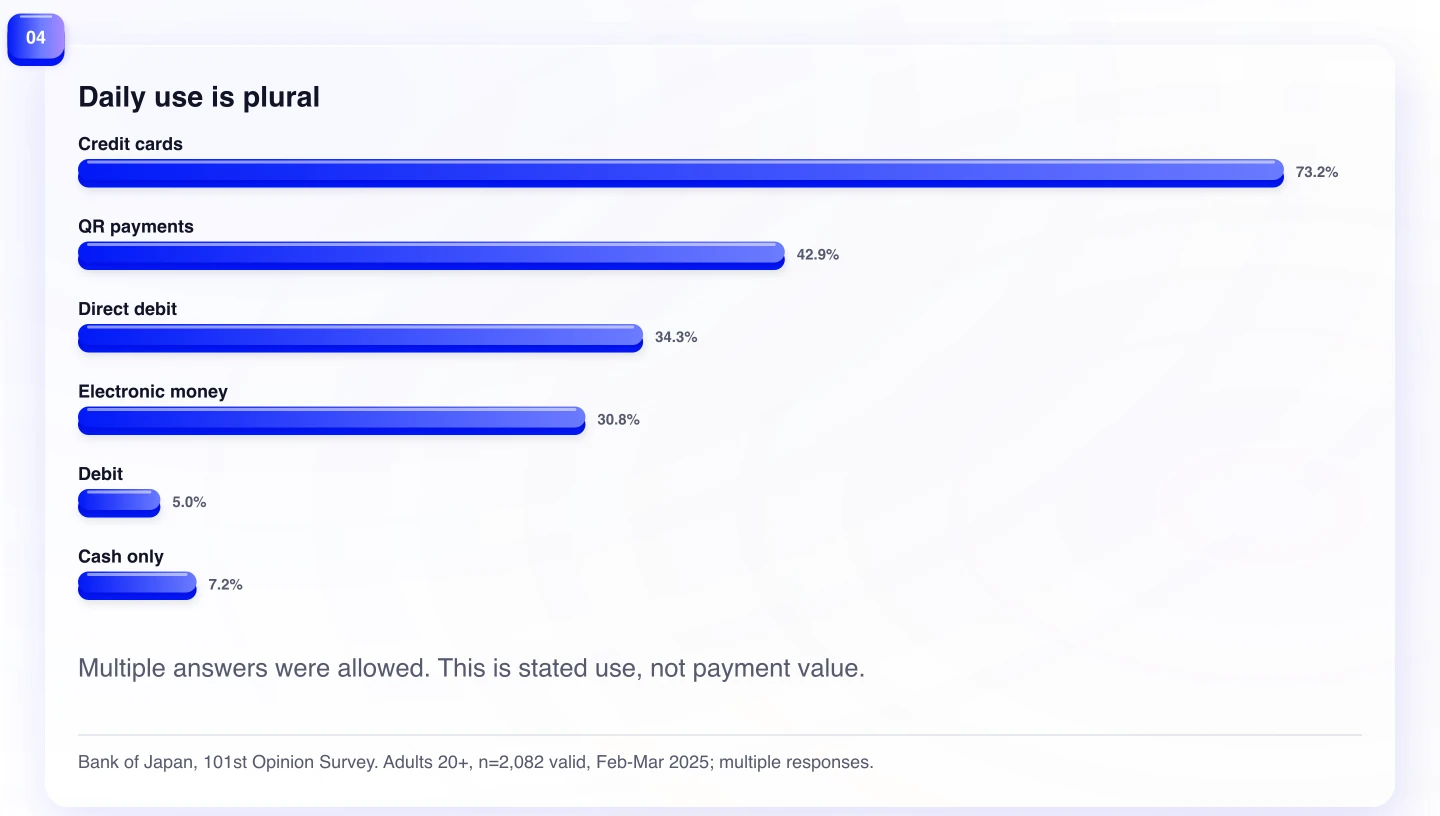
These are daily-use answers, not the value shares in METI's calculation. The two datasets should not be joined into a single bar chart or treated as interchangeable. One describes the value of transactions by method. The other records respondents' stated daily use of methods, with multiple methods allowed.
Still, their disagreement is informative. The daily-payment environment is visibly plural. People can use cards, QR payments, direct debit, and electronic money in the same period. Yet the value indicator remains strongly concentrated in cards. A payment method can be part of everyday life without carrying a proportionate share of spending value.
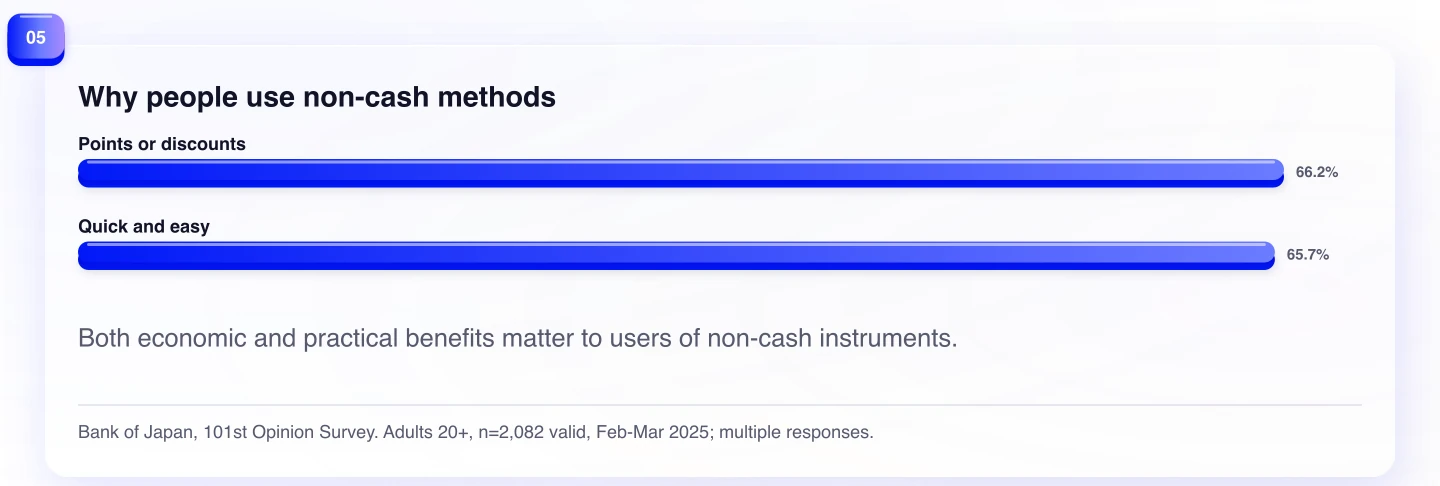
The survey also gives a modest clue about the appeal of non-cash instruments, though not about any one brand's conversion. Among respondents who used at least one payment instrument other than cash, 66.2 percent cited reward points or discounts, and 65.7 percent cited quick and easy payment. Those are multiple-response reasons, not a ranking of products. They suggest that the checkout proposition includes both economic and practical benefits.
The Statistics Bureau's household evidence adds another boundary. In its 2024 survey, 74.1 percent of two-or-more-person households had members who owned electronic money, and 63.5 percent had members who used it. That is a high level of household reach. It is not a national estimate of all individual payment behavior, nor does it say how much value those households put through electronic money.
Reach, daily use, and payment value are different questions. A market entry plan should keep them separate.
Why this changes an overseas checkout
The familiar localization checklist can encourage a menu mentality: add a few Japanese payment logos and the checkout feels local. The evidence does not justify that shortcut. It suggests starting with the flow that underpins the most payment value, then testing where other methods solve a specific job.
For cards, inspect the whole path rather than the presence of a logo. Test a domestic card in the environment where customers will use it. Check authorization and retry behavior, the clarity of the merchant name, the currency and tax explanation, the receipt, cancellation, refund timing, and human support after an error. These are product and operations tasks, not mere integrations.
Then treat additional methods as hypotheses with a defined audience or context. A QR method may help in a mobile-first acquisition flow. Electronic money may matter in a particular retail or transit-adjacent setting. Direct debit may fit a recurring bill. The public figures do not tell us which of those will lift conversion for a subscription, a marketplace, a premium imported product, or a low-ticket repeat purchase. That must be measured in the actual category.
The order matters because feature count can hide fragility. A checkout that displays five choices but mishandles its card path gives the customer more options to see and fewer routes to complete. A checkout with fewer choices and a clear, recoverable card flow may be more useful while the team learns what its Japanese buyers actually want.
The objection: value is not preference
There is a strong objection to this article's central reading. Payment value is not frequency, preference, or category fit. A smaller-value method can be common for small purchases. A card's high value share does not prove that every shopper wants to use one, and it says nothing by itself about which method is best for a particular basket size or age group.
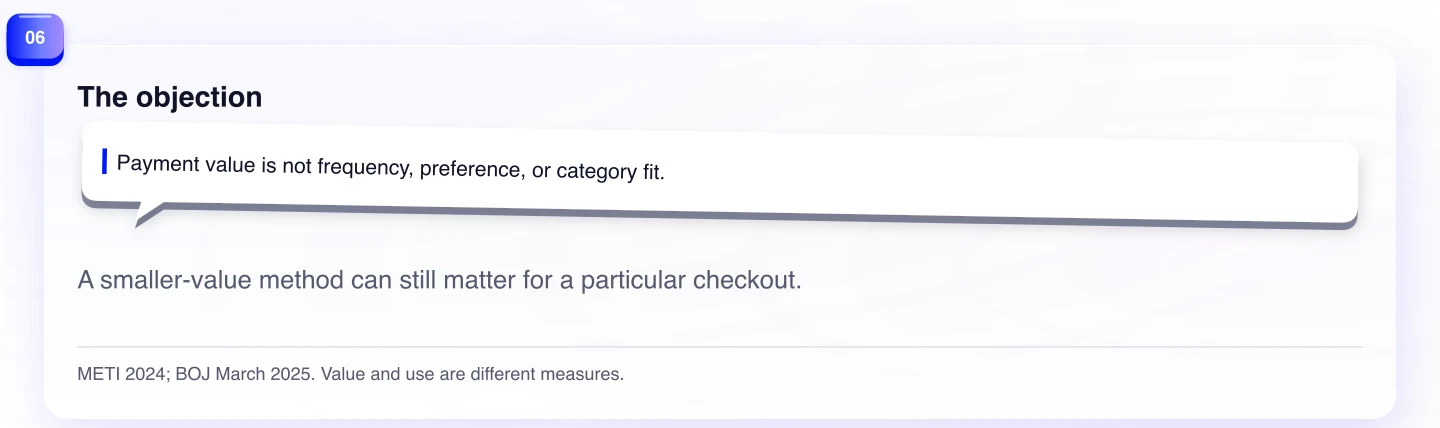
The objection is correct. It is why the article does not say that every Japanese customer prefers cards, or that every merchant should add no other method. The BOJ survey itself shows daily use across several instruments. A generic card-only conclusion would replace one stereotype with another.
But the objection does not erase the operational baseline. A business that enters a market in which cards carry 82.9 percent of officially measured cashless value should have a reason, backed by its own evidence, before treating card performance as secondary. The public data tells the team where to begin its due diligence. It does not complete the choice for them.
What remains unknown
The official sources do not show the payment-method mix inside a particular online checkout, merchant segment, product category, foreign brand, or age group. They do not establish what happens to conversion when a business adds a code-payment option. They do not show whether customers who use cards daily would abandon a purchase when another method is absent.
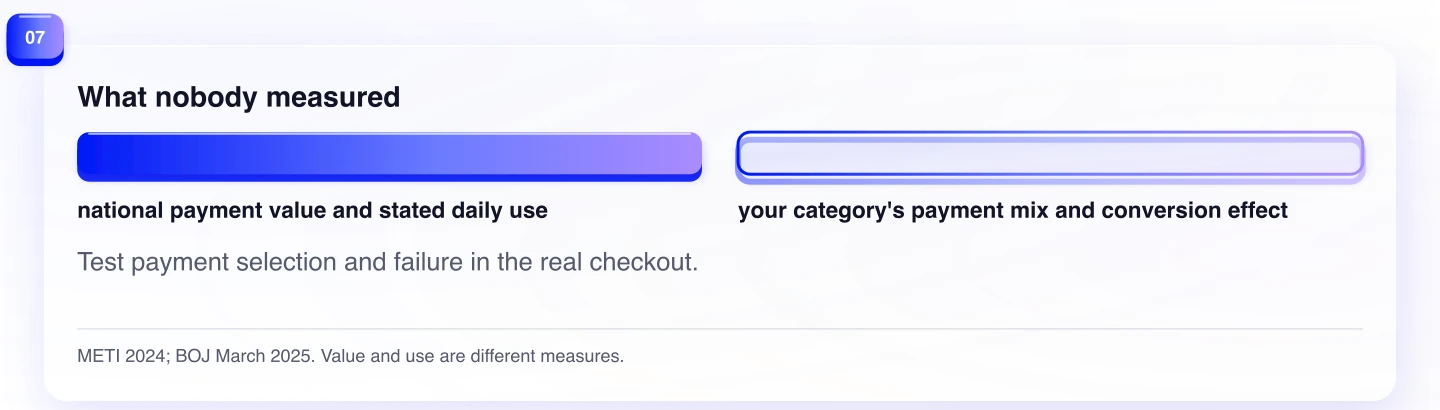
Those gaps are not a reason to discard the national evidence. They are a reason to use it at the right level. National statistics can frame the problem; checkout data, customer research, and controlled payment tests have to answer the company-specific question.
Start with three measurements. Record payment-method selection at checkout, not only completed orders. Separate authorization failures from customer abandonment. Then compare support contacts and repeat purchase by payment path. If a local method improves a defined segment's completion rate without increasing operational failure, it has earned a place. If it merely adds interface weight, remove it.
Japan has become cashless enough that a non-cash plan is no longer optional. It has not become a market where the payment rails are interchangeable. Begin with the rail carrying the value, then let evidence from your own checkout decide what deserves to sit beside it.
Evidence
Sources
The works below support the article's factual claims and were rechecked on .
- 2024 Ratio of Cashless Payment Among the Total Amount Paid by Consumers CalculatedMinistry of Economy, Trade and Industry · March 31, 2025 · Accessed August 10, 2026
- 2023 Ratio of Cashless Payment Among the Total Amount Paid by Consumers CalculatedMinistry of Economy, Trade and Industry · March 29, 2024 · Accessed August 10, 2026
- Results of the 101st Opinion Survey on the General Public's Views and BehaviorBank of Japan · April 11, 2025 · Accessed August 10, 2026
- Summary Results of the 2024 Survey of Household EconomyStatistics Bureau of Japan · February 7, 2025 · Accessed August 10, 2026