Market Structure
Contraction is concentrating the market.
Written by Kaito Yoshizumi
- Published
- Last checked
- Reading time
- 10 minutes

Direct answer
Japan's preliminary 2025 census gives market-entry teams a number that is easy to misread. The national population was 123.05 million, down 2.5 percent from 2020. At the same time, the Tokyo metropolitan area held 36.986 million people, or 30.1 percent of the country. The useful story is not simply that Japan is getting smaller. It is that contraction and concentration are occurring together, changing where an offer can first become operationally dense.
That is a market-structure observation, not a demand forecast. A population count does not tell a company who will buy its product, how much they can spend, or whether a category works outside its first city. It does, however, challenge the comfortable habit of treating Japan as one evenly available national market, then treating demographic decline as a single reason to withdraw from it.
The national number is real, but incomplete
The Statistics Bureau's preliminary count places Japan's population at 123.05 million on 1 October 2025. That was 3.097 million fewer people than in 2020. For a planning deck, the number is concise: a large, mature market with fewer residents than five years earlier.
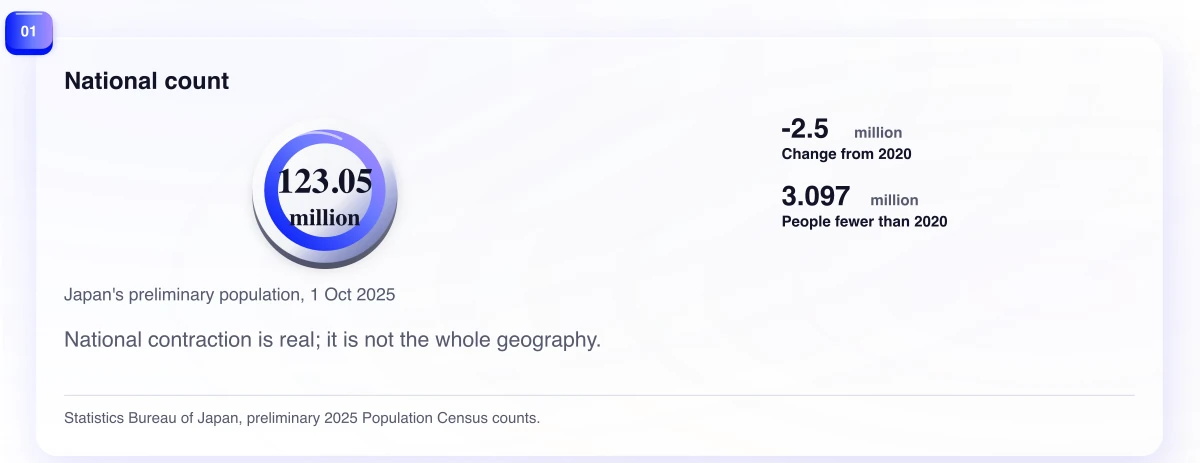
It is also the beginning of the analysis, not its conclusion. The same release says that Japan had 57.125 million households, up 2.3 percent over the period, while average household size fell to 2.15. A national headcount, a household count and a category's addressable demand are related but different objects. Reducing them to one “shrinking market” label loses the differences that determine packaging, service coverage, distribution and sales motion.
The result is preliminary. The Bureau has scheduled later complete tabulations on population, households, housing and internal migration. That matters because a preliminary count is exceptionally useful for the national outline, but it is not yet a full map of the conditions an operator may care about. It should be named as preliminary rather than upgraded into a finished local-demand diagnosis.
The familiar decline story has a missing geography
The familiar explanation is understandable. A country with fewer people appears to offer fewer future customers. It can prompt a sensible concern about long-run volume, staffing and market size.
What that explanation misses is the geography inside the total. The Census release defines the Tokyo metropolitan area as Tokyo, Kanagawa, Saitama and Chiba. Together, those four prefectures had 36.986 million people in 2025. That is 30.1 percent of the national population. Tokyo-to alone had 14.246 million.
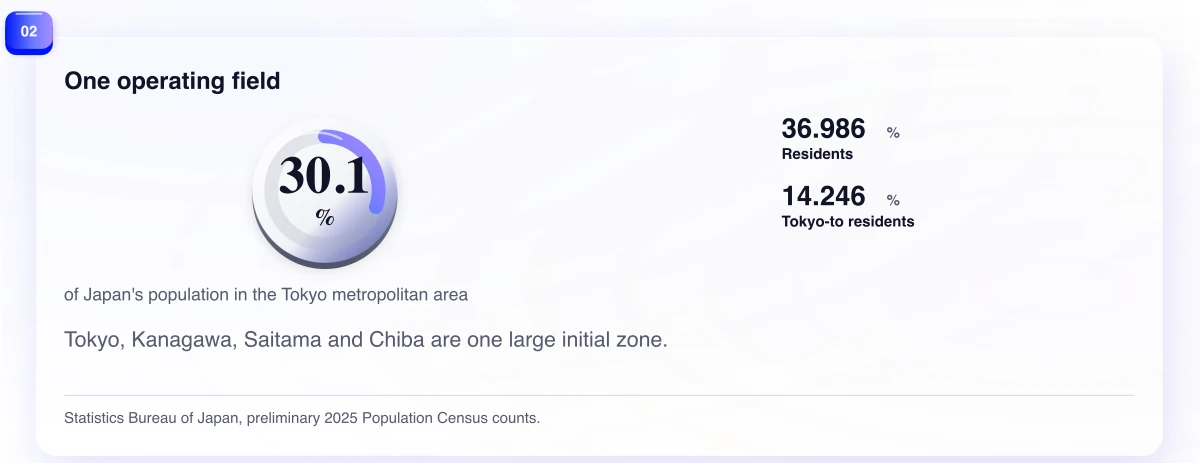
This does not mean Tokyo is “Japan,” nor that every offer should launch there. It means a national denominator conceals a very large operating zone. For businesses that depend on concentrated reach, in-person service, short delivery cycles, partner density, recruiting pools or repeatable field learning, density can change the first economics of entry.
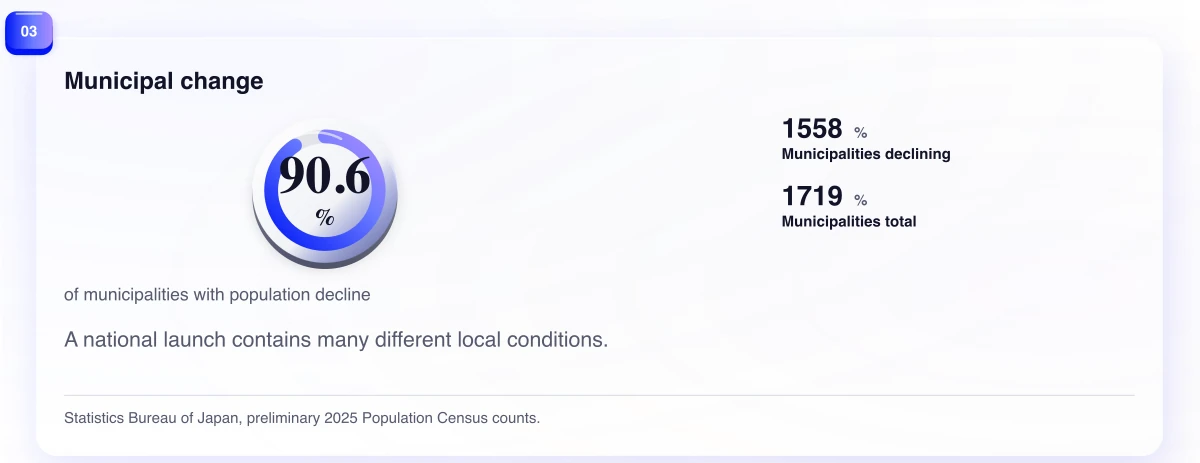
The municipal result makes the other side visible. Population declined in 1,558 of Japan's 1,719 municipalities, or 90.6 percent. That is not an instruction to ignore those places. It is a warning against assuming that a national launch has one underlying market shape. A service that acquires, delivers, supports and retains customers efficiently in a dense corridor may need a different cost structure, partner model or product promise in a smaller municipality.
Concentration changes the question before it changes the answer
The tempting response is to declare victory for the largest metropolitan area. That is too easy. Concentration can reduce the cost of finding initial customers, but it can also intensify competition, raise channel costs and expose an offer to a narrower mix of early users. A product may work in a dense initial zone because existing infrastructure, professional networks or delivery capacity makes it easier to operate there. None of that proves a second city will behave the same way.
The better question is two-part. First: where can this offer become credible and operationally reliable? Second: what must remain true for it to travel from that location? The first is about initial density. The second is about portability.
That distinction is practical. A business selling a product with hands-on installation might begin where technicians can serve a compact catchment. A software company may begin where the relevant buyer community is easier to reach and local references can circulate. A brand may find that a metropolitan launch validates a message but says little about regional distribution, inventory risk or the role of local intermediaries. These are hypotheses to test, not conclusions supplied by the census.
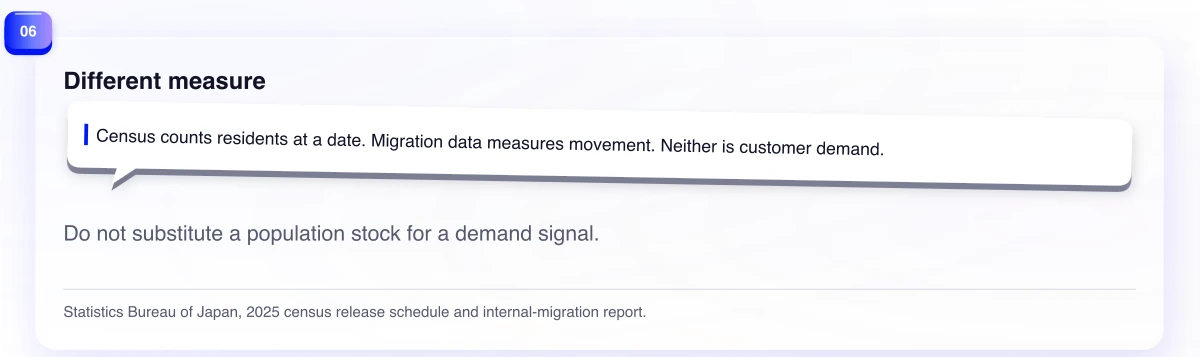
The Statistics Bureau's internal-migration series is a useful methodological reminder. It measures movement between municipalities and prefectures; the census measures the stock of residents at a point in time. Flows and stocks answer different questions. A city can have a large resident base without telling an entrant who has recently moved, who commutes, or who will change supplier. Do not use one measure as if it were the other.
A municipality is not a market
This is where demographic commentary often overreaches. Municipalities are administrative units. They do not map neatly onto a category's service area, a customer's willingness to travel, a sales territory or a delivery route. A population decline does not tell us whether the remaining residents are relevant buyers. It does not show their income, the local competitive set, broadband quality, transport access, retail format or the cost of an on-the-ground relationship.

Equally, a metropolitan population share does not make a commercial case. Thirty percent of national residents in the Tokyo metropolitan area is not thirty percent of a company's opportunity. It can be a reason to run a more focused first test. The evidence for the opportunity still has to come from the category: buyer interviews, search behaviour, partner availability, conversion, activation, repeat use and the actual cost to serve.
This is a useful discipline because demographic statistics are seductive. They have authority, clean denominators and very large numbers. They should shape the questions around an offer, not impersonate its traction data.
The counterargument: density can be a trap
There is a strong counterargument to a concentration-first entry plan. A dense initial market can produce a false positive. Teams may reach early adopters, well-connected buyers or customers served unusually cheaply by existing infrastructure. They can then mistake a local operating advantage for broad category demand.
The opposite error is possible as well. Regional markets should not be treated as one residual “outside Tokyo” segment. A category may be more viable where its use case matches local industry, housing, mobility or distribution. Population decline does not erase those conditions.
The census evidence therefore supports neither a Tokyo-only thesis nor a national-uniform thesis. It supports a narrower claim: population structure should make a team explicit about where it is testing, what concentration is doing for the test, and what evidence would show that the result travels.
What remains unknown
The preliminary counts do not tell us category-level demand, customer income, commuting patterns, delivery cost, local competition or the economics of a particular service. They do not reveal whether a product that works in the Tokyo metropolitan area will work in another prefecture, nor whether it will work for the same reason.
They also cannot tell a team whether its own offer is made stronger or weaker by household change. The increase in household count alongside a lower average household size may matter to some categories, but the census does not prescribe a package, price or channel.
There is an additional timing limit. Population is counted at a reference date, while market operations unfold through seasons, budget cycles, contracts and changing local supply. A five-year census comparison is a sturdy structural signal, but it cannot replace current field observation. Teams should be wary of attaching a precise quarter-by-quarter sales forecast to it.
Build a two-level entry test
Start with an operating-zone map rather than a national heat map. Define a small initial geography where the team can name the target buyer, the route to reach them, the local partner or service dependency, and the expected support burden. Measure the real work there: acquisition cost, time to first value, delivery or onboarding failure, support escalation and repeat behaviour.
Then design the portability test before declaring the first result a market result. Select a second geography that changes one important condition: density, industry mix, delivery distance, partner availability or buyer context. Keep the proposition clear enough to learn whether the offer travels, then document what had to change. It may be channel, packaging, sales assistance, support hours or nothing at all.
This approach also makes the decision reversible. A company does not have to choose between a national launch and a permanent single-city strategy. It can earn the next geographic step with evidence, preserving the distinctions that the national figure conceals. The discipline is especially useful when a team is tempted to describe every early customer as representative simply because the national market is familiar in aggregate.
The point is not to deny the national contraction. It is to stop asking the number to do more than it can. Japan's 2025 preliminary census describes a country with fewer people, more households and a large concentration of residents in one metropolitan area. That is a map of constraints and possible starting points. The commercial decision begins when a team can explain how its own offer moves across that map.
Evidence
Sources
The works below support the article's factual claims and were rechecked on .
- News Bulletin June 25, 2026: Preliminary Counts of the 2025 Population Census of JapanStatistics Bureau of Japan · June 25, 2026 · Accessed August 10, 2026
- 2025 Population Census: Summary of the results and statistical tablesStatistics Bureau of Japan · May 29, 2026 · Accessed August 10, 2026
- Report on Internal Migration in Japan, 2025Statistics Bureau of Japan · February 3, 2026 · Accessed August 10, 2026