Culture and Commerce
Japan uses digital services. It has not decided to trust them.
Written by Kaito Yoshizumi
- Published
- Last checked
- Reading time
- 11 minutes

Direct answer
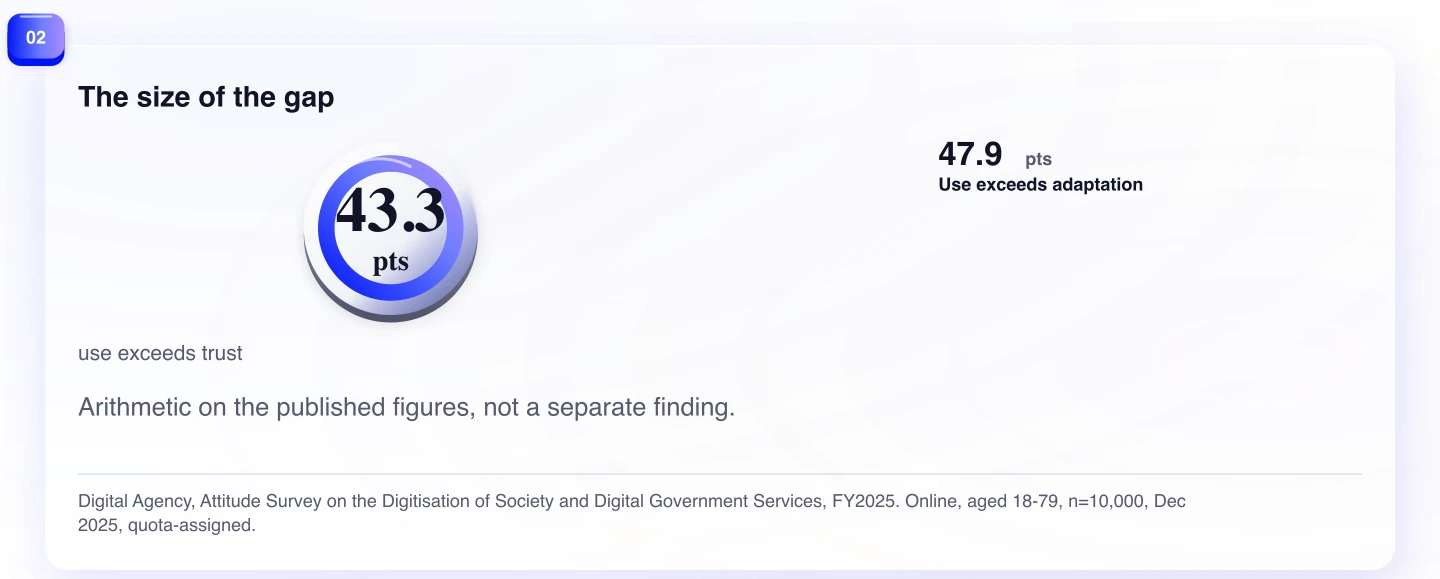
Japan is often described as a country that is behind on digital. The better description is more uncomfortable: people use digital services while withholding some of their confidence from them. In the Digital Agency's 2025 attitude survey, 80.9 percent said they had used a digital government service at least once, but 37.6 percent said they trusted digital government services. Use exceeded trust by 43.3 points.
That gap is not proof that Japanese users reject digital products. It is evidence that adoption and endorsement are different states. An overseas team entering Japan should design for a user who may complete the transaction, return to the service, and still want a human fallback or a clear explanation of what happens next.
The familiar pitch: Japan is behind on digital
The familiar pitch has a visible surface. Some ceremonies remain associated with physical presence, paper, or face-to-face responsibility. A company sees those habits and concludes that the market needs to be persuaded to move online.
The evidence does not support a simple lag story. Hakuhodo's first fixed-point digital-life wave in 2024 found digital use already past half in four domains, including information gathering and small in-store payments. Eight more domains sat between thirty and fifty percent, while the remaining seventeen were below thirty percent. Fashion, medical consultation, and travel were near ten percent.
The pattern is uneven, not absent. Digital is already ordinary in some tasks and still contested in others. A useful market question is therefore not “Will Japan adopt digital?” It is “Which part of the digital experience has already become routine, and which part still needs reassurance?”
What the DX survey actually asked
Both fixed-point digital-life waves were online surveys of 5,000 men and women aged 15 to 69 nationwide. They were quota-assigned to the 2020 census population structure across eight regions by region, sex, and age. The second wave ran from 3 to 5 March 2025, and the first ran from 22 to 25 March 2024.
The survey measures attitudes about what people would accept as an online activity. It does not measure completed transactions in a particular commercial product. That distinction matters because acceptance can describe a changing norm without telling a company whether its own service will be trusted at the point of use.
The second wave found that more than four in ten respondents would accept an online version of four occasions previously assumed to require presence: a school open day, handing over a wedding gift envelope, submitting a resignation, and a job interview. Among respondents in their teens and twenties, the figure passed fifty percent for the school open day and the job interview, and approached fifty percent for the wedding envelope and resignation letter.
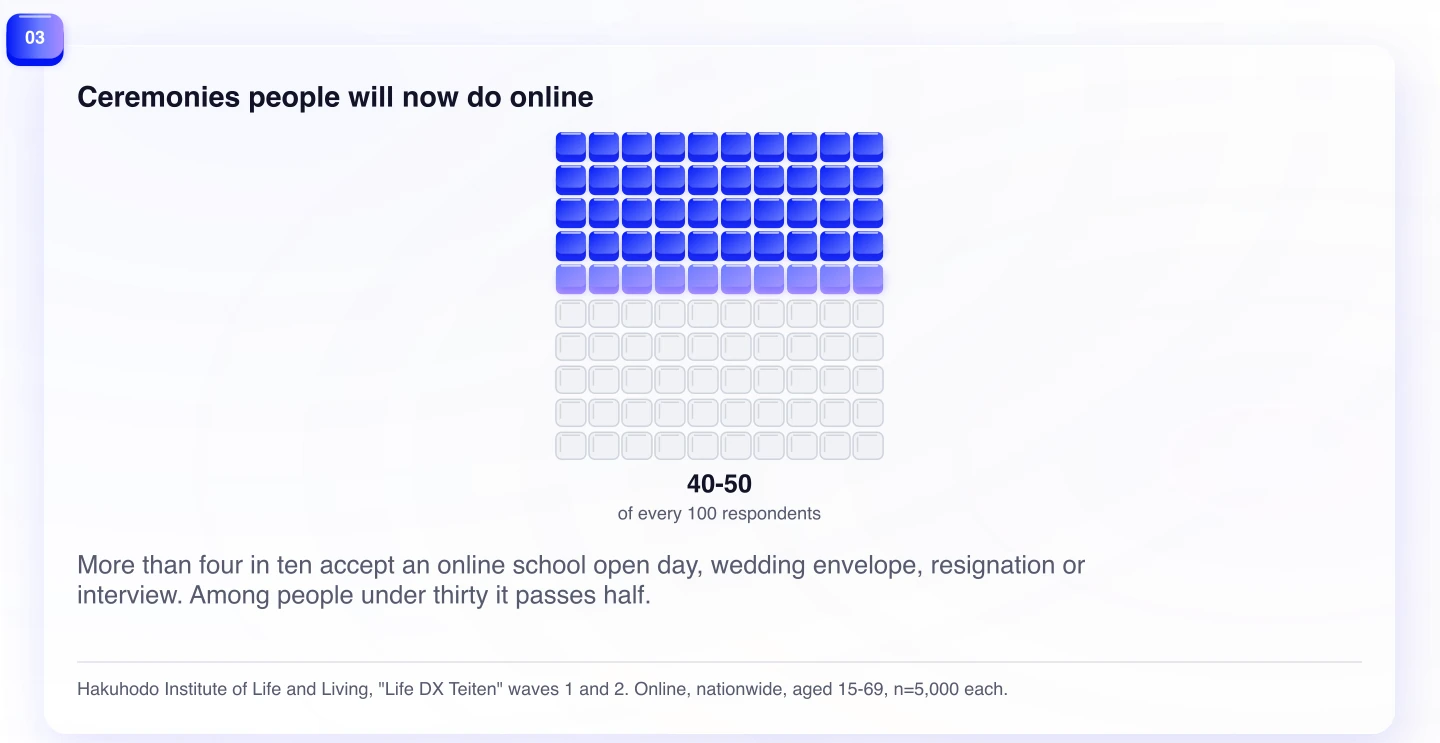
The same younger age group exceeded the all-respondent figure by 12.2 points on the job interview, 9.9 points on apologising at work, and 9.4 points on school lessons. These are attitude results. They show that the boundary of acceptable online behavior can move, especially among younger respondents. They do not show that every service in those categories has already moved online.
The ceremonies people will now do online
The examples are revealing because they are not low-stakes clicks. A school open day can involve a relationship between families and an institution. A resignation can carry responsibility and emotion. A job interview asks both sides to assess another person. The survey result says that a significant share of respondents can imagine these moments online; it does not say that the digital channel removes the need for trust.
That is the distinction an overseas product can miss. A user may accept the interface and still ask who stands behind the outcome. The online form may be easy. The consequences may remain social, financial, or professional.
The first wave supplies a second warning against a single adoption score. It found digital use past half in some activities and near ten percent in fashion, medical consultation, and travel. Different categories ask users to surrender different kinds of control. The service that handles a simple information search does not establish the service that asks a user to disclose health information or make a consequential booking.
The four questions most surveys collapse into one
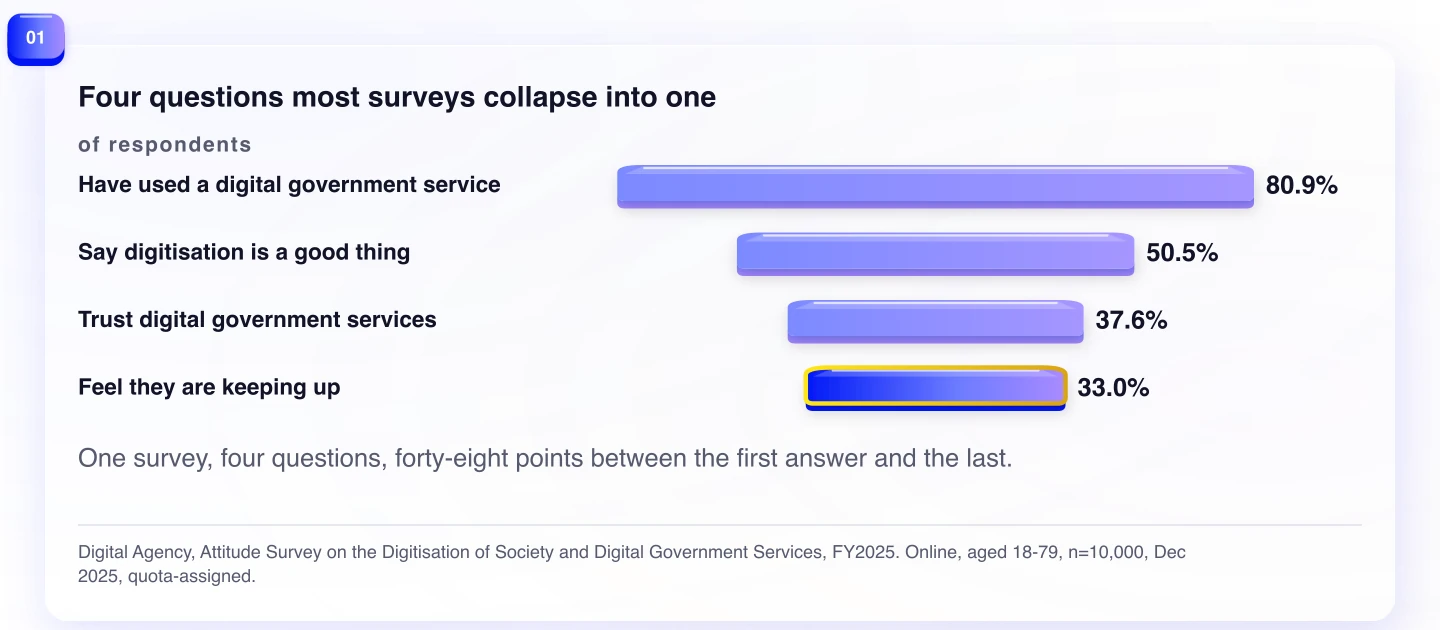
The Digital Agency's 2025 attitude survey separates four questions. It asks whether respondents have used a digital government service, whether they think the digitisation of society is good, whether they trust digital government services, and whether they feel they are keeping up with digitisation.
The answers spread widely. 80.9 percent said they had used a digital government service at least once. 50.5 percent said the digitisation of society is a good thing. 37.6 percent said they trust digital government services. 33.0 percent said they feel they are keeping up with it.
Use exceeds trust by 43.3 points and exceeds self-assessed adaptation by 47.9 points. These are not four versions of digital adoption. They are four positions a person can hold at the same time: “I have used it,” “I approve of the direction,” “I trust the service,” and “I feel able to keep up.”
Taken together, the picture is of digital services being adopted without a fully digital-first disposition. People may use the service and withhold their confidence from it. That is not a defect in the user. It is an operating condition for the service.
Use is not endorsement
Official usage data supports the adoption side of the picture. Individual internet use in Japan reached 85.6 percent in 2024, up from 9.2 percent in 1997. Use among people aged 70 to 79 was 69.8 percent, and use among people aged 80 and over was 33.1 percent. Social media use stood at 79.0 percent overall and 60.1 percent among people aged 65 and over.
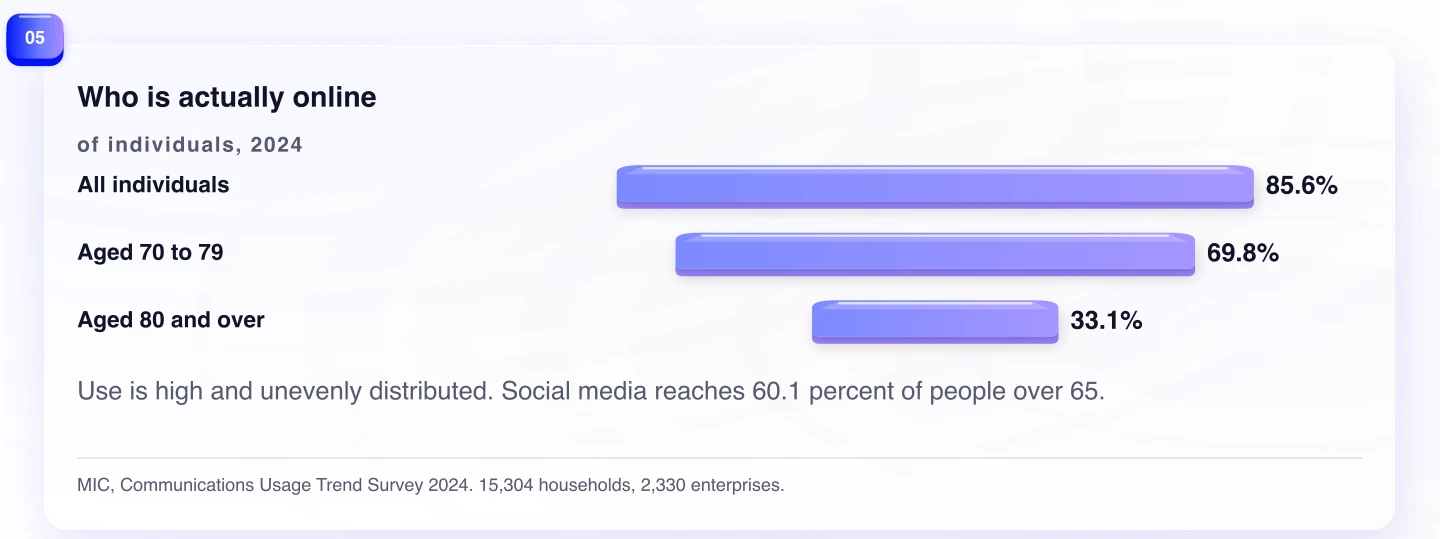
The Communications Usage Trend Survey sampled 40,592 households and received 15,304 valid replies, covering 37,058 household members, with results weighted to the 2020 census. Its enterprise arm sampled 6,040 firms with 100 or more regular employees and received 2,330 valid replies. Both describe the position at the end of August 2024.
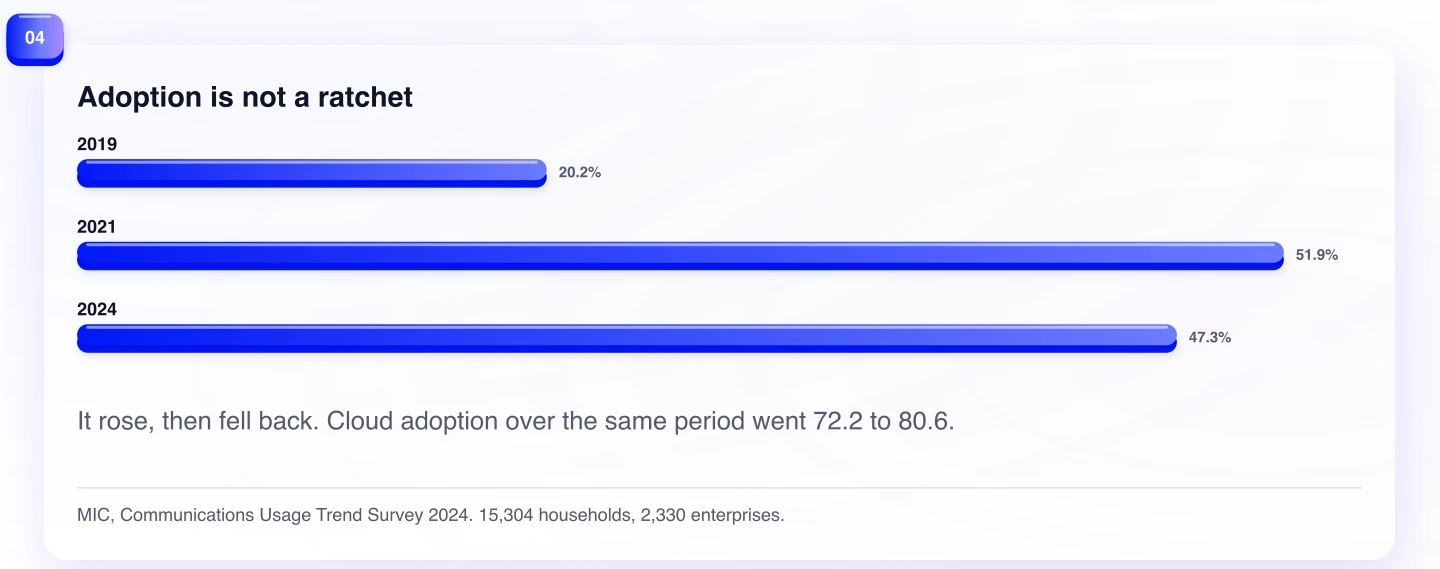
Cloud service adoption among Japanese companies rose from 72.2 percent in 2022 to 80.6 percent in 2024. Telework adoption rose from 20.2 percent in 2019 to 51.9 percent in 2021, then fell back to 47.3 percent in 2024. Adoption is not a ratchet. A service can spread, retreat, and remain part of the available toolkit without becoming the default way people prefer to work.
The official statistics describe behavior and organizational adoption. The Digital Agency survey describes attitudes toward digital government services. The two evidence types should not be mixed into one trust score. High internet use does not answer whether a user trusts a particular service, just as low self-assessed adaptation does not mean a user cannot complete a digital task.
The gap also changes how a team should read a successful launch. Completion may indicate that the task was possible, while support requests may indicate that the user still needed permission, reassurance, or a record of what happened. Those signals should not be combined into one adoption number. A product that measures only completion will miss the cost of uncertainty that appears after the click.
When the gap does not transfer
The strongest objection is that the government-use gap may not travel to commerce. A citizen may be obliged to use a government service regardless of trust. A commercial customer can walk away, choose another bank, abandon a subscription, or keep a human process. If so, low trust in a public service could say little about the private digital market.
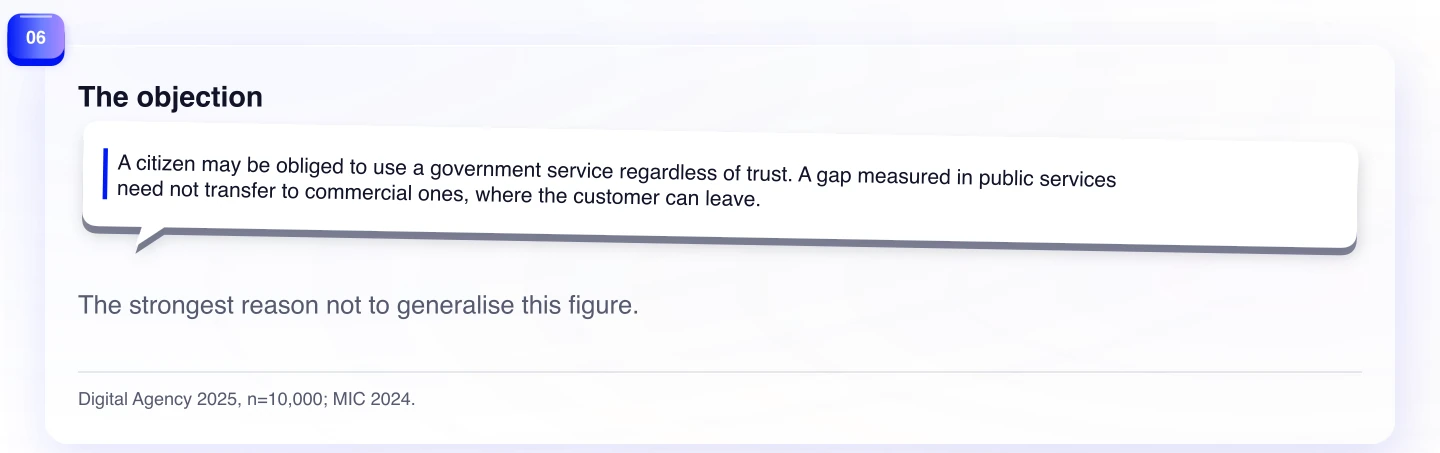
That is a serious objection, and it should be answered at full strength. The government result is not a license to claim that Japanese consumers distrust every online shop, bank, or subscription service. It measures digital government services. The distinction protects the commercial argument from overreach.
It also makes the result more useful. If public-service use can coexist with low trust, then a private service should not assume that repeated use proves confidence. A customer may use the product because it is convenient, because alternatives are worse, or because the task must be completed. The reason has to be tested in the product context.
What remains unknown
Whether the same gap between use and trust holds for private digital services in Japan — commerce, banking, and subscriptions — is not measured by these sources. The article cannot turn a government attitude figure into a national commercial trust statistic.
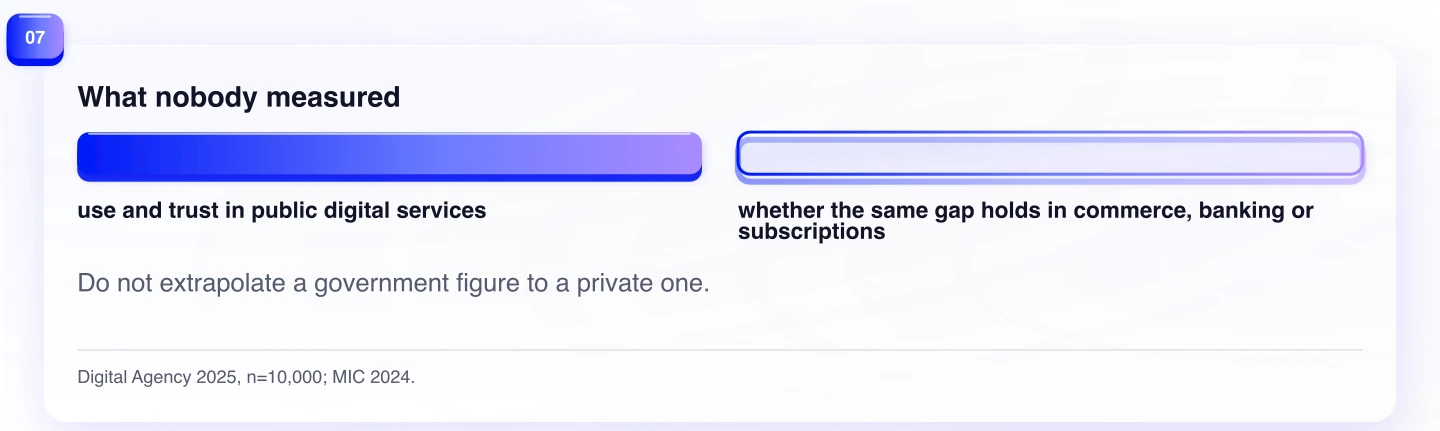
That unknown should shape the next research step. Ask users what they trust, what they merely tolerate, and what would make them seek a human route. Do not infer the answer from login frequency alone. A service can have high usage and still leave the user uncertain about responsibility, recovery, or the meaning of a decision.
The same interview should distinguish confidence before use from confidence after use. A customer may trust the company enough to begin and still distrust the result because the confirmation is vague. That sequence is a product question the national sources cannot answer, but it is exactly the kind of question an overseas team can test with its own users.
What an overseas team should build for
Design the main path for completion and the support path for doubt. Explain what the user has done, what will happen next, who is responsible, and how to recover if the result is wrong. Keep those explanations close to the action that creates the uncertainty.
Then test the fallback instead of treating it as a failure of digitisation. A phone number, human review, confirmation step, or visible escalation route may be part of the product's trust architecture. The sources do not prove that every Japanese user wants one. They show why an overseas team should not remove it merely because usage is high.
Finally, label the evidence in every internal presentation. The 80.9 percent and 37.6 percent figures are attitude results from a 10,000-response, nationwide online quota survey of people aged 18 to 79 conducted in December 2025. The internet and enterprise figures come from a national communications survey with household and firm samples, describing the end of August 2024. The fixed-point digital-life results are separate national attitude waves among 5,000 people aged 15 to 69.
Japan has not refused digital services. It has accepted them without granting them automatic trust. The practical question is not how to push the user further into the funnel. It is what the user still needs to believe after the transaction is complete.
Evidence
Sources
The works below support the article's factual claims and were rechecked on .
- 博報堂生活総合研究所「生活DX定点」第2回調査Hakuhodo Institute of Life and Living · June 24, 2025 · Accessed August 8, 2026
- 博報堂生活総合研究所「生活DX定点」第1回調査Hakuhodo Institute of Life and Living · September 5, 2024 · Accessed August 8, 2026
- 総務省 通信利用動向調査 2024年Ministry of Internal Affairs and Communications · December 31, 2024 · Accessed August 8, 2026
- デジタル庁 社会のデジタル化やデジタル行政サービスに関する意識調査 2025年度Digital Agency · December 31, 2025 · Accessed August 8, 2026