Commerce and Infrastructure
Japan's ecommerce market is huge. Its merchandise market still has room offline.
Written by Kaito Yoshizumi
- Published
- Last checked
- Reading time
- 10 minutes

Direct answer
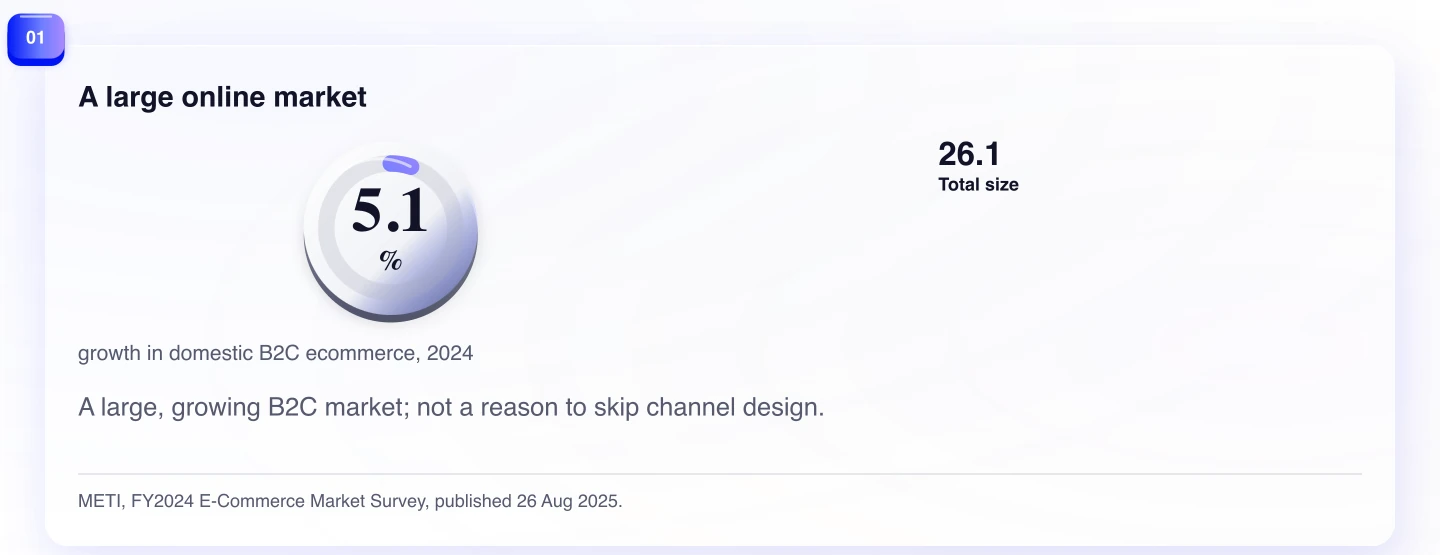
Japan's B2C ecommerce market reached 26.1 trillion yen in 2024. That is large enough to make an online-only launch feel self-evident. Yet METI's merchandise EC ratio for the same year was 9.8 percent. The tension is not evidence that one figure is wrong. It is evidence that market size and channel share answer different questions.
The useful reading is not that Japan is late to ecommerce, or that offline retail has somehow escaped digital change. It is that a large online market can coexist with a much larger merchandise market whose offline route still shapes discovery, reassurance, delivery, and competition. For an overseas brand, that is a channel-design problem, not a choice between two stereotypes.
The familiar pitch: 26.1 trillion yen means the market is already online
The headline number makes a strong case for urgency. METI estimated domestic B2C ecommerce at 26.1 trillion yen in 2024. That was 5.1 percent higher than the 24.8 trillion yen estimated for 2023, and well above the 22.7 trillion yen estimate for 2022.
An overseas team can reasonably look at that expansion and conclude that the first Japanese customer should be acquired online. The market is real, large, and growing. A local marketplace, a direct site, or a social-commerce funnel may all deserve attention before a store network or distributor conversation begins.
What the headline does not settle is how much of the relevant market is actually online. It also does not say whether a category needs a physical encounter, a retail partner, a local return path, or an offline credibility signal before an online purchase feels easy. Those questions sit behind the EC ratio.
Why the two headline figures do not contradict each other
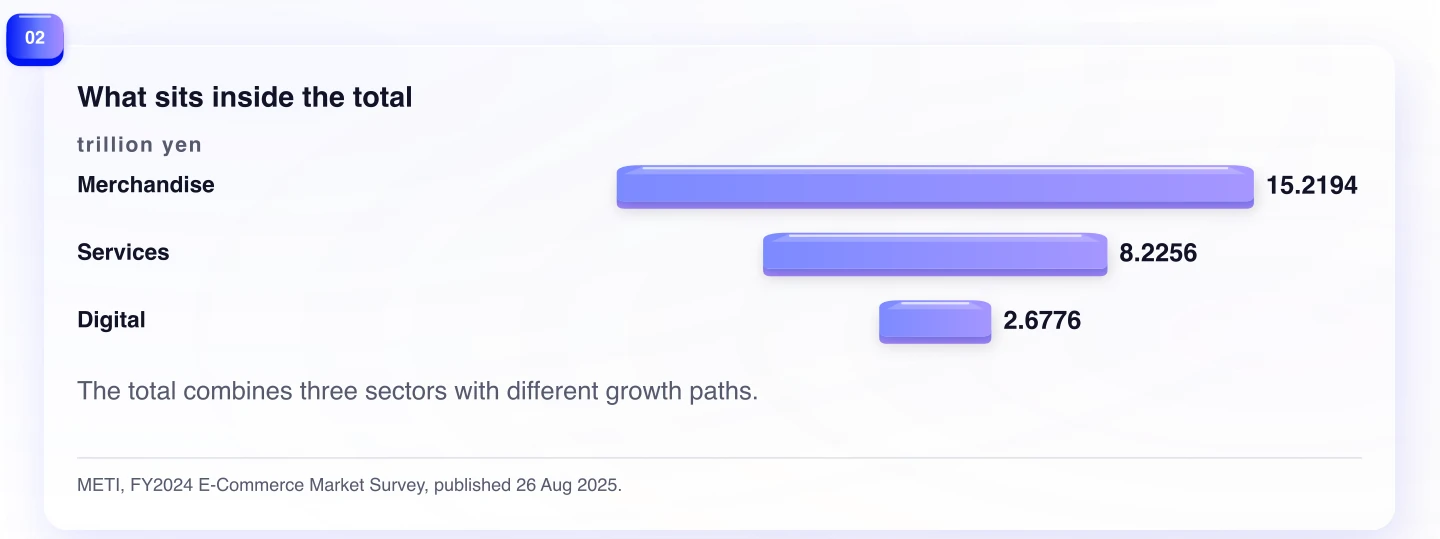
METI's 26.1 trillion yen B2C total combines three sectors. Merchandise ecommerce accounted for 15.2194 trillion yen. Services accounted for 8.2256 trillion yen. Digital transactions accounted for 2.6776 trillion yen. Their year-on-year changes were different too: 3.70 percent for merchandise, 9.43 percent for services, and 1.02 percent for digital.
The 9.8 percent figure is not the online share of that whole 26.1 trillion yen total. METI defines the B2C EC ratio as ecommerce's share of all commercial transaction value and limits its B2C calculation to the merchandise sector. In 2024, that merchandise EC ratio was 9.8 percent, up 0.4 percentage points from 9.38 percent in 2023.
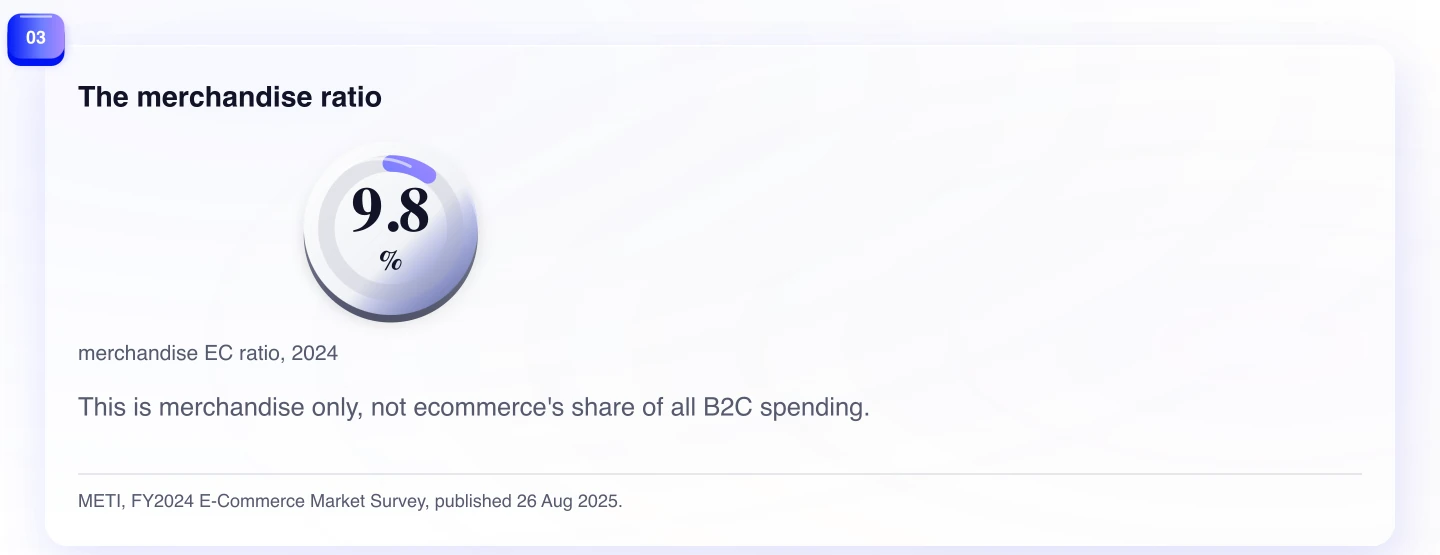
That definition is easy to miss because the market total and the ratio appear together in the same release. The total tells us that online transactions across merchandise, services, and digital goods have substantial scale. The ratio asks a narrower question: within the merchandise market, what share of transactions has moved online?
The narrowness does not make the ratio less useful. It makes it more useful for a brand that sells physical goods. A large total ecommerce market can be good news for online operations while a 9.8 percent merchandise ratio remains a warning against assuming the physical route is merely a legacy channel.
A large online market can still leave most merchandise offline
The word "offline" can make the situation sound static. It is not. A customer can discover a product on a phone, compare it online, inspect it in a store, and later reorder from a site. A retailer can make an online purchase feel safer by handling delivery, returns, advice, or local availability. The EC ratio does not separate those journeys.
It does show that the final commercial transaction for most merchandise value was not counted as ecommerce under METI's definition. That gives an overseas company a different starting question: where does physical presence still do work that a page, ad, or marketplace listing does not?
The answer will vary by category. In the 2024 merchandise figures, food, drinks, and liquor were the largest online category at 3.1163 trillion yen. Clothing and apparel goods reached 2.7980 trillion yen; domestic electrical appliances, AV equipment, PCs, and peripherals reached 2.7443 trillion yen; and household goods, furniture, and interiors reached 2.5616 trillion yen.
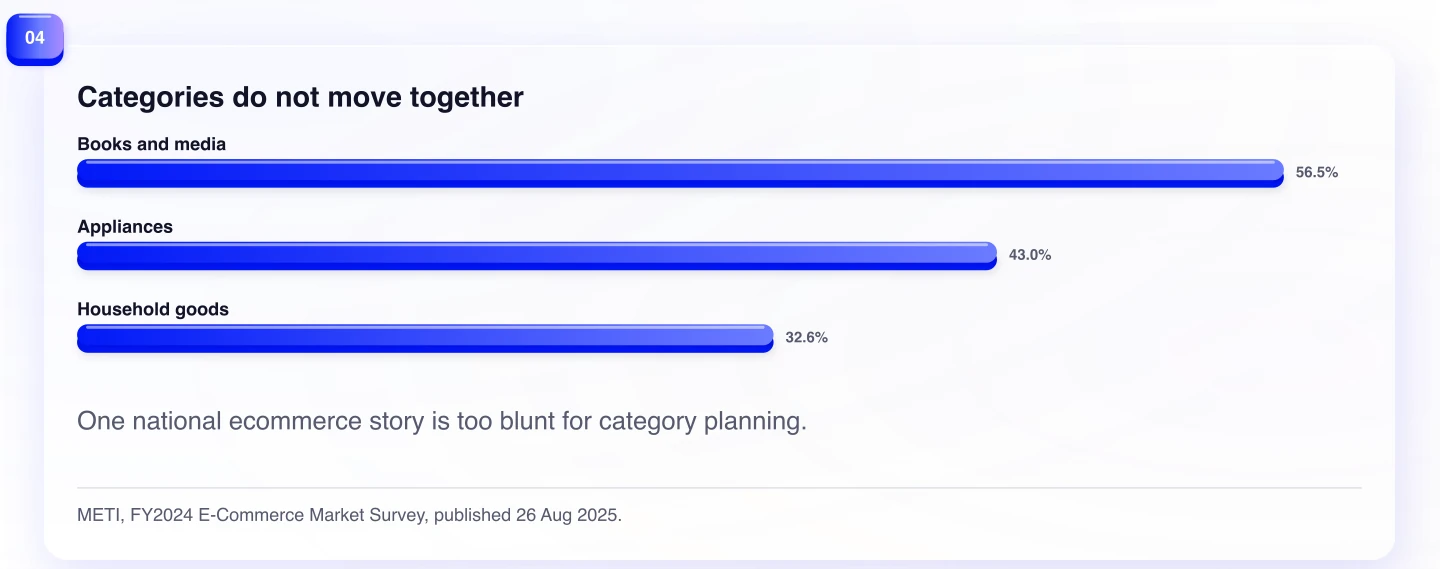
Those large online categories do not have identical channel structures. METI reported EC ratios of 56.45 percent for books and media software, 43.03 percent for electrical appliances and related equipment, and 32.58 percent for household goods, furniture, and interiors. The category differences are the point. Ecommerce is not a national switch that has been turned on or off. It is a set of product-specific channel arrangements.
For an overseas brand, the implication is practical. A category with substantial online penetration may still need a local delivery promise or an easier way to return a purchase. A category with lower online penetration may need an in-person trial, a trusted retailer, or some other form of confidence before the first order. The official statistics establish neither explanation. They tell the team not to skip the question.
Household buying does not settle the channel question
The Statistics Bureau's 2024 household survey confirms that internet ordering is ordinary for a large share of households. Among two-or-more-person households, 55.3 percent ordered goods or services on the internet in 2024. Average monthly expenditure on those orders was 24,928 yen, up 8.3 percent in nominal terms from the previous year.
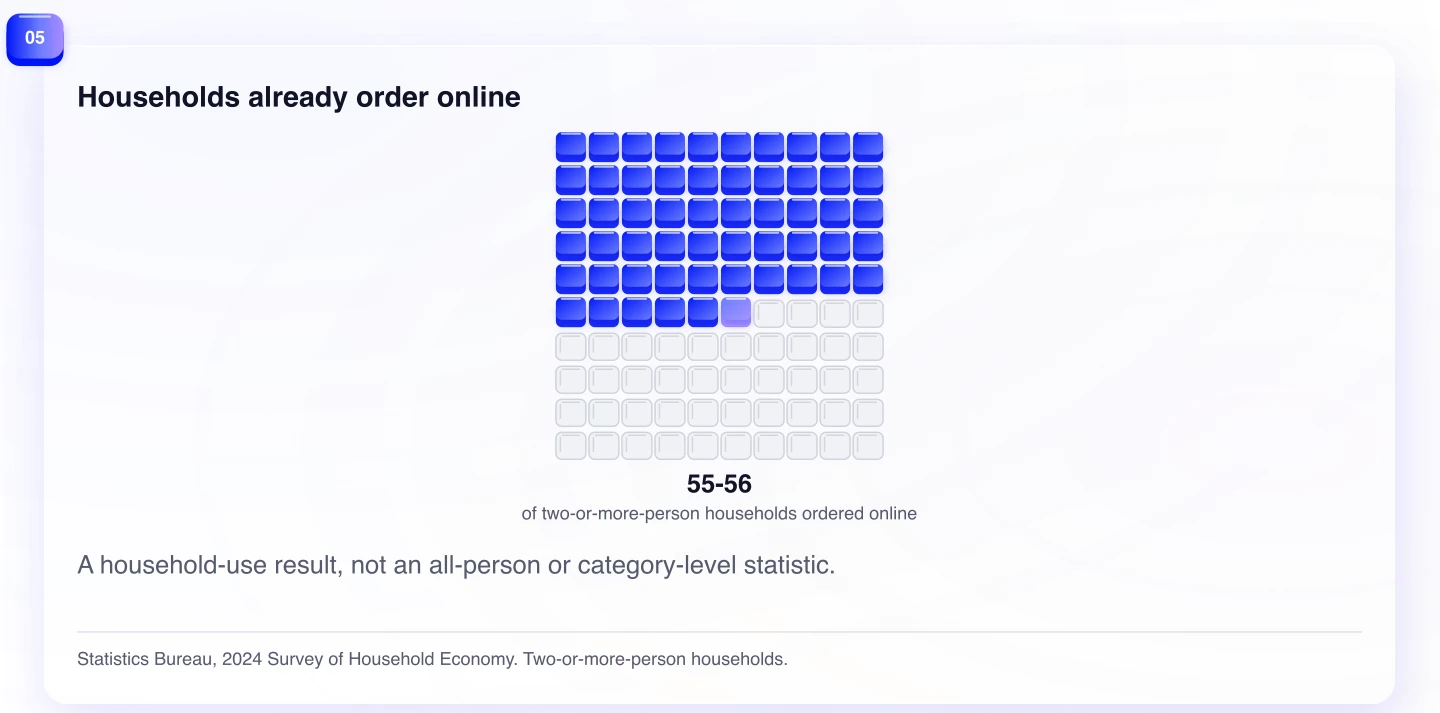
This is a useful behavioral signal, but it answers neither of the questions that a market-size headline can tempt us to skip. First, the result is restricted to two-or-more-person households. It is not a statistic for every individual consumer in Japan. Second, it records whether households ordered goods or services online and the amount they spent; it does not map the complete market for any product category.
The household result and METI's market result nevertheless point in a compatible direction. Online ordering is not a marginal habit. Online commerce is not a small market. Yet the merchandise ratio remains below one tenth. The proper conclusion is not that one source cancels the other. It is that adoption at the household level and a large online market do not eliminate the commercial importance of offline merchandise routes.
The same caution applies to C2C. METI estimated C2C ecommerce at 2.5269 trillion yen in 2024, up 1.82 percent. The ministry also warns that this estimate is not confined to transactions strictly between individuals; it can include B2B and B2C transactions. A resale or marketplace signal should therefore be read with its scope attached, rather than added casually to a brand's addressable market.
What an overseas brand should test
The quickest route into Japan is often framed as a binary decision: launch a site first, or secure offline distribution first. The data suggests a more useful sequence. Start with the category's purchase journey. Identify where people discover the product, where they need confidence, where delivery or returns create friction, and what an offline touchpoint contributes after online discovery has already happened.
Then test the smallest channel combination that can answer the open question. For a physical product, that might be a local site with a narrow assortment and a retail partner that supplies trial or returns. For a service, it may be an online purchase supported by local customer care. For a higher-consideration item, it may be an online waitlist followed by a temporary physical demonstration.
The goal is not to imitate the largest domestic retailer or to build every channel at once. It is to find the part of the buying journey that cannot yet be assumed to happen online. The 9.8 percent figure is a reason to investigate that part, not a prescription to open stores.
METI's methodology reinforces the need for care. The FY2024 survey was the 27th annual edition of a series that began in fiscal 1998. Its detailed report captures sales-side amounts from businesses with a domestic base. It includes sales exported from Japan but excludes imports into Japan and sales by overseas production that do not pass through Japan. The number is a carefully defined market estimate, not a universal map of every customer journey.
The objection: 9.8 percent is not all B2C spending
The strongest objection to this article is also the most important methodological correction. The 9.8 percent EC ratio is a merchandise-sector measure. It is not ecommerce's share of all B2C spending, and it cannot support a claim that 90 percent of every consumer category remains offline. The 26.1 trillion yen total includes services and digital transactions, while the ratio does not use those sectors as its B2C base.
That objection narrows the conclusion. It does not remove it. A company that sells physical merchandise still needs to understand the ratio's scope, because the ratio is designed for the part of the economy in which it operates. A company selling travel, financial services, games, or other digital goods should not borrow the merchandise conclusion without checking its own category.
The category comparison already shows why. Books and media software, appliances, and household goods have very different EC ratios. A single national ecommerce story is too blunt for all three.
What remains unknown
The available official sources do not show a particular foreign brand's customer-acquisition cost, retail-partner effect, return behavior, category-level channel economics, or the conversion impact of opening an offline channel. They do not tell a team whether a direct site, marketplace, distributor, pop-up, or retail partner will be the most efficient first route.
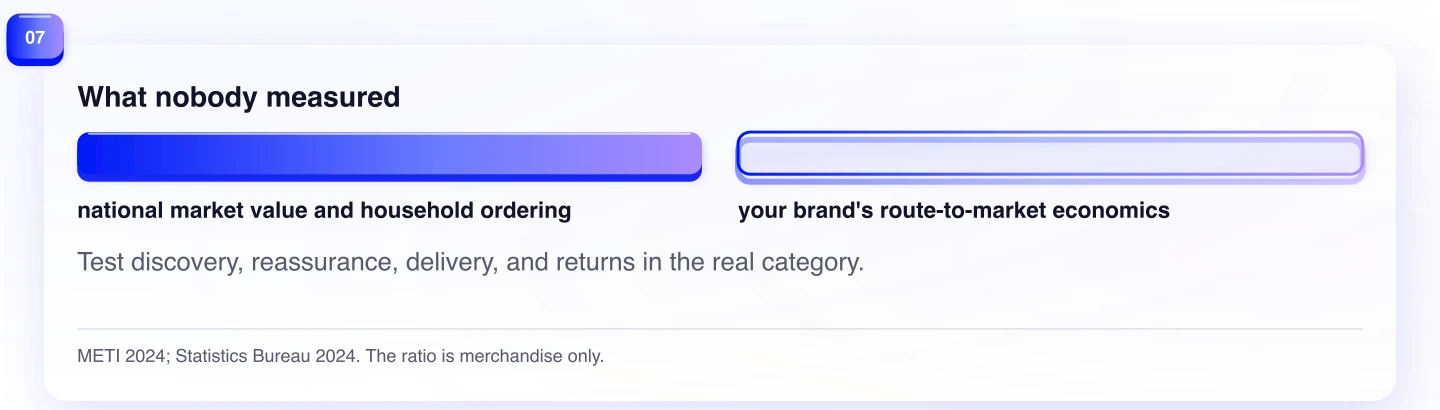
Those are not failures of the statistics. They are the questions a market-entry test is meant to answer. Track how prospective buyers arrive, what stops an order, whether a physical touchpoint changes the result, and what happens after delivery. Separate discovery from transaction, and transaction from reassurance.
Japan's ecommerce market is already too large to dismiss. Its merchandise market is still too offline to treat the physical route as an afterthought. The better launch plan is not online versus offline. It is a disciplined answer to where your category still needs the customer to cross the gap between them.
Evidence
Sources
The works below support the article's factual claims and were rechecked on .
- Results of FY2024 E-Commerce Market Survey CompiledMinistry of Economy, Trade and Industry · August 26, 2025 · Accessed August 10, 2026
- FY2024 E-Commerce Market Survey ReportMinistry of Economy, Trade and Industry · August 26, 2025 · Accessed August 10, 2026
- Results of FY2023 E-Commerce Market Survey CompiledMinistry of Economy, Trade and Industry · September 25, 2024 · Accessed August 10, 2026
- Summary Results of the 2024 Survey of Household EconomyStatistics Bureau of Japan · February 7, 2025 · Accessed August 10, 2026