Market Structure
Inward investment is growing in large assets.
By Japan Legible
- Published
- Last checked
- Reading time
- 10 minutes

Japan's inward-investment headline is strong. JETRO reports 2.5 trillion yen of inward FDI flow in 2024, a 53.3-trillion-yen inward FDI stock at year-end, and a record 31.6 billion dollars of greenfield investment. The same account notes prominent large data-center and logistics projects. Those figures are evidence that capital is moving and selected large assets are being built. They are not, by themselves, evidence that local demand is broad across categories or places.
That distinction can sound pedantic until it changes a decision. A company can see investment into data centers, logistics facilities and related infrastructure, infer that “Japan is opening,” and treat that as a shortcut around customer research. The investment may be real and commercially important. But a balance-of-payments flow, an investment stock and a greenfield project figure each describe something different from the number of buyers, their unmet problem, or the repeatable economics of a new offer.
The record headline is worth taking seriously
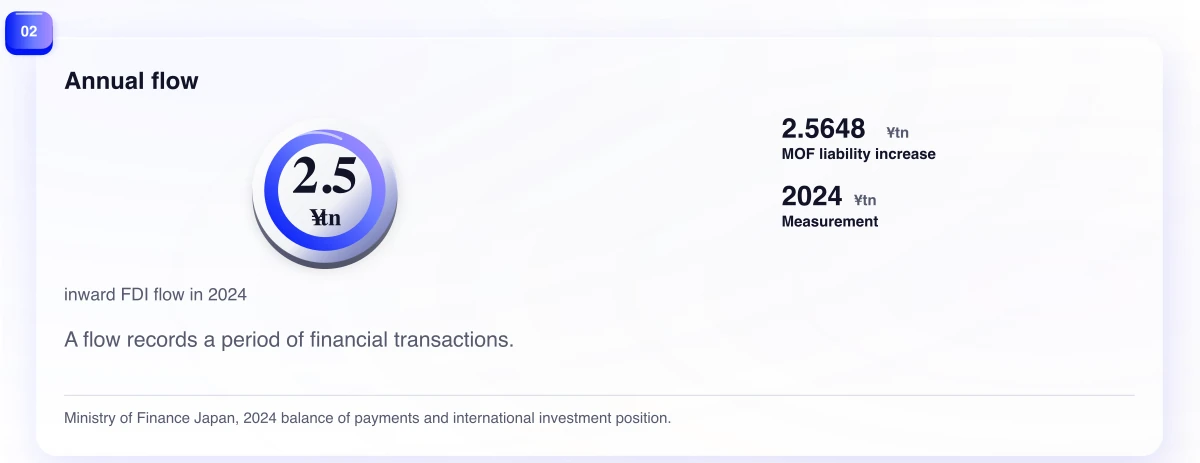
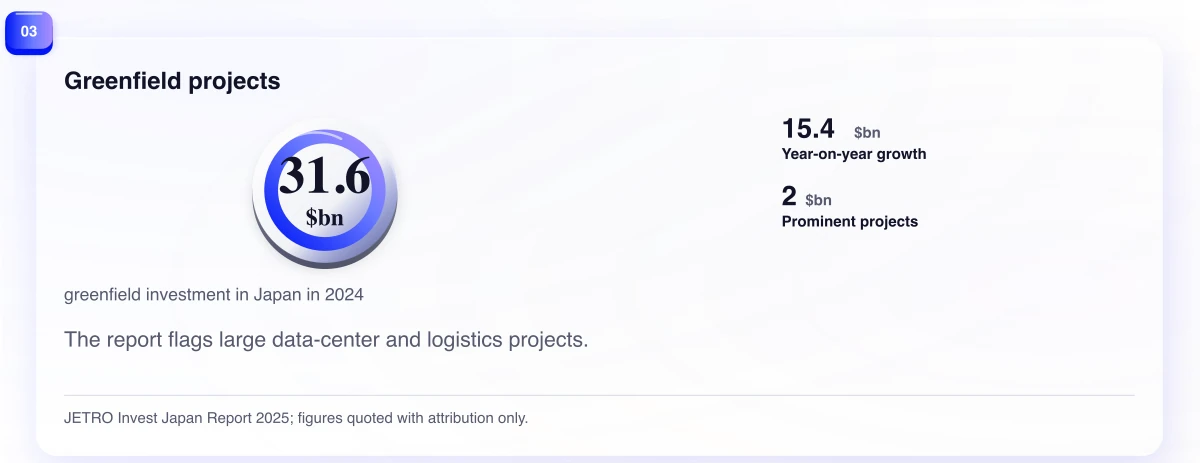
JETRO's Invest Japan Report 2025 says inward FDI flow in 2024 totalled 2.5 trillion yen. It places inward FDI stock at 53.3 trillion yen at the end of the year, 4.5 percent higher than a year earlier. It also reports greenfield investment of 31.6 billion dollars, up 15.4 percent year on year.
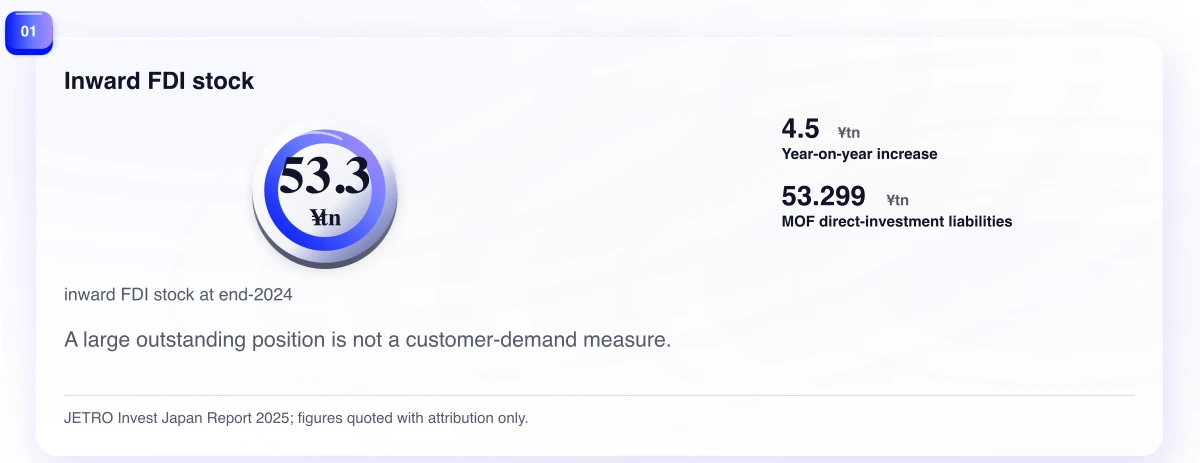
The Ministry of Finance provides an important cross-check. Its preliminary 2024 balance-of-payments release recorded a 2.5648-trillion-yen increase in direct-investment liabilities. Its international-investment-position release recorded direct-investment liabilities of 53.299 trillion yen at year-end, compared with 51.014 trillion yen at the end of 2023. The rounded JETRO figures align with the official series rather than standing alone as a promotional headline.
The Bank of Japan subsequently released the end-2024 international-investment-position data as annually revised figures. That is not a reason to discard the earlier figures. It is a reminder that these are formal statistical series with revisions and definitions, not a loose count of business enthusiasm.
Three numbers, three clocks
The word investment can conceal the difference between a flow, a stock and a project value.
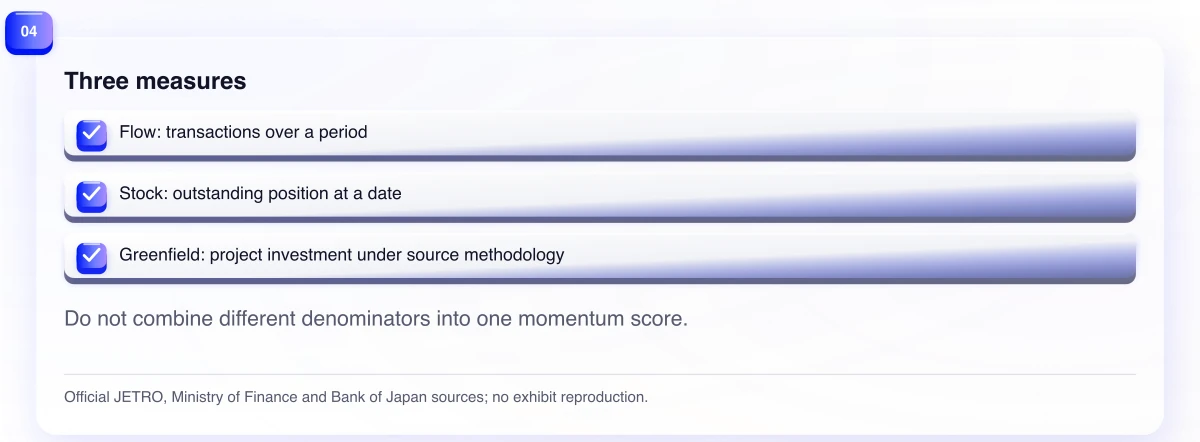
A flow records financial transactions over a period. The 2024 inward FDI flow tells us about a year of net direct-investment transactions. A stock is an outstanding financial position at a date. The 53.3-trillion-yen figure is a balance-sheet position at year-end, not 53.3 trillion yen of new customer spending in 2024. Greenfield investment, meanwhile, captures a project-investment measure under the source's methodology. It can be useful for seeing where announced or recorded physical capacity is appearing, but it does not have the same denominator as the financial-account series.
That is why the figures should not be combined into a single momentum score. Doing so implies a continuity that the measures do not have. A strong stock can reflect past accumulation, valuation and reinvestment as well as new activity. A flow can be positive even if large individual investors are entering and withdrawing capital. A large project may take years to construct, operate and reach utilisation.
The report itself offers a useful complication: U.S. investment implementation and withdrawals both reached record values in 2024, leaving a net withdrawal in that bilateral result. Aggregate investment data can contain large opposing movements. “More FDI” is therefore a less precise operational claim than it first appears.
Large assets have a different commercial clock
JETRO identifies large data-center and logistics-facility projects as prominent in the greenfield result, linking them to AI-related business demand and logistics automation and labour saving. It is reasonable to pay attention. These are substantial assets with long construction, permitting, procurement and operating cycles. They can create opportunities for specific suppliers, sites, technical services, enterprise software and supporting infrastructure.
But this is exactly why they should not be converted into a general demand claim. A data center can increase capacity before it shows local utilisation. A logistics facility can reflect a retailer's network design, an automation programme or a long-term land decision. The customers of those assets, the locations they serve, the lease terms, the employment they create and the supplier effects they generate are not supplied by the headline greenfield total.
For an overseas company, the useful question is not whether big assets exist. It is whether the asset changes the company's actual bottleneck. A cloud-security product might have a direct adjacency to new data-center capacity. A consumer subscription with no relationship to that infrastructure does not inherit its demand. A logistics project may reduce a distribution constraint for one category while making no difference to the reason customers choose another.
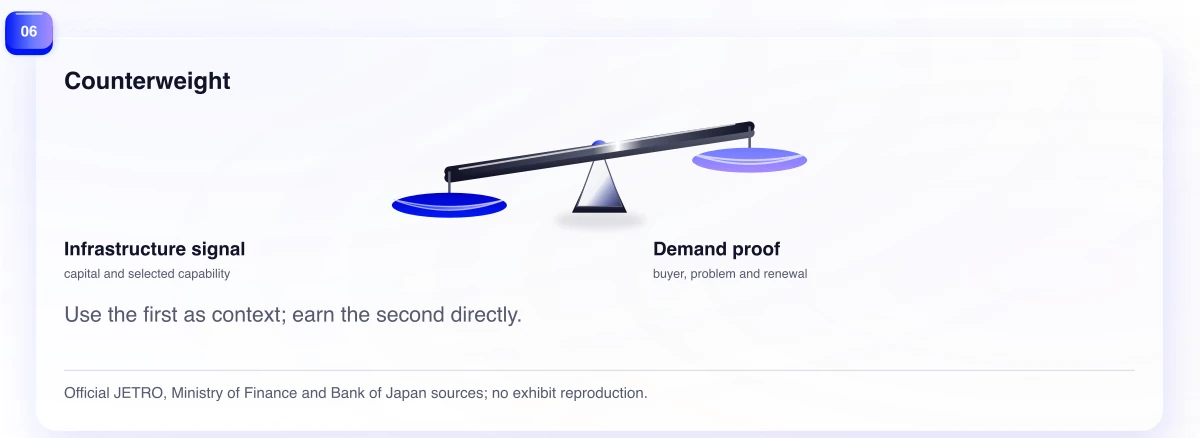
Infrastructure signal, not a demand substitute
Inward investment can be valuable context in a market-entry thesis. It can reveal where capital is willing to make long-lived commitments, where certain capabilities may be gathering, and where competition for sites, talent or suppliers may intensify. It can also show that an entrant is not operating in a static environment.
That context needs an explicit handoff to local evidence. The next evidence should be category-specific: the buyer's job, current alternative, procurement route, price tolerance, deployment burden and reason to renew. It should be geographic where geography matters: a specific operating zone, the distribution distance, local partner availability, customer concentration and the service level the offer can maintain.
This is especially important because investment headlines can feel more decisive than they are. They are official, national and measured in large sums. Those qualities make them excellent for describing capital formation. They do not make them a customer survey.
The counterargument: large projects can change real conditions
The counterargument should not be waved away. Large infrastructure projects can have real spillovers. They may create new procurement needs, make capacity available, attract suppliers, or signal an operating environment that is improving for a tightly related business. Refusing to look at them would be as shallow as treating them as proof of universal demand.
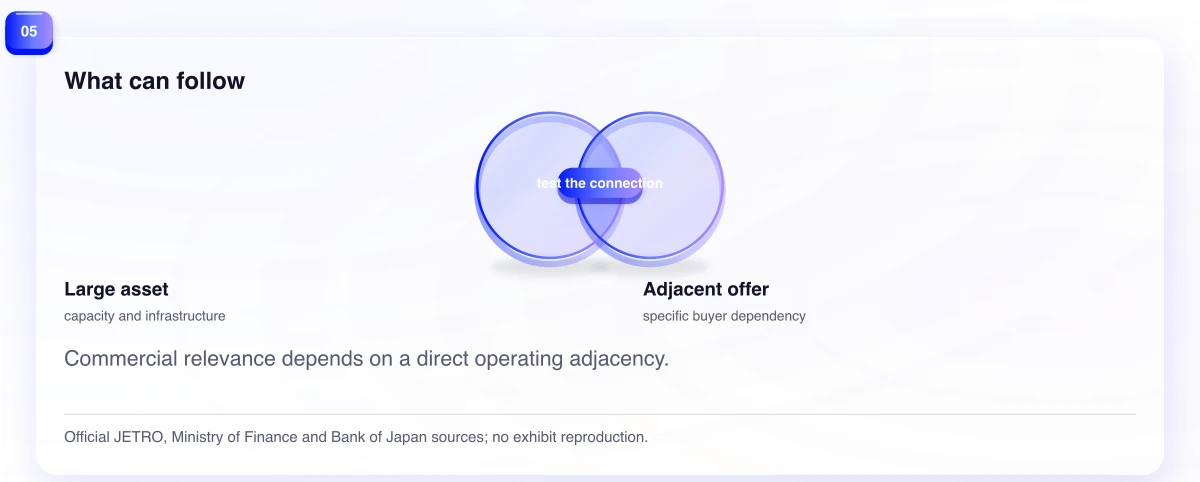
The key is proximity. The closer an offer is to the asset's construction, operation, financing, energy use, data requirement or distribution function, the more plausible the connection. Even then, the connection is a hypothesis until the team can identify an actual buyer and an actual buying process.
The FDI data does not tell us the size of that spillover. It does not establish that every project creates local purchasing, that purchasing reaches a particular entrant, or that a supplier relationship becomes recurring revenue. The appropriate conclusion is conditional: treat the asset as a lead to investigate, not as proof that the lead is qualified.
What remains unknown
The cited sources do not identify the local customers, utilisation, lease terms, employment, supplier spillovers, geographic distribution or category-level sales generated by individual investments. They cannot tell us whether a project is early-stage, fully contracted, or commercially relevant to an unrelated product.
They also do not reveal the counterfactual. Without category evidence, we cannot know whether demand would have appeared without the investment, whether the project displaces capacity elsewhere, or whether its benefit is concentrated among a small set of incumbent firms.
There is a measurement limit as well. JETRO's report is a carefully useful compilation, but the headline figures should retain their source dates and definitions. The report states that its information base was current to September 2025. A team using the 2024 figures to make a 2026 decision should check whether the specific project, buyer and regulatory condition that matters to it is still current.
Test the connection, not the headline
Use a simple adjacency test. List the specific asset or investment theme, the direct operating dependency it might change, the buyer who would feel that change, and the evidence that buyer would leave behind. For a data-center theme, that might be a procurement process, a compliance requirement, a capacity constraint or a named partner ecosystem. For logistics, it might be a route, fulfilment threshold, warehouse interface or service-level promise.
Then ask what would falsify the narrative. If no local buyer can name the new constraint or opportunity, if the procurement path remains closed, or if the asset serves a different geography, do not borrow its momentum for the offer. Keep the investment signal in the context section and let customer evidence decide the market case.
It is also worth separating an asset's construction phase from its steady state. Construction can create a short procurement window; operation can create a longer but more specialised one. The relevant commercial motion, decision maker and qualification criteria may be entirely different. Treating both as “demand from the project” is a reliable way to call on the wrong buyer with the wrong offer.
That separation should appear in the launch plan, not only in the research memo.
The same test protects against a more subtle error: reverse causality. A project can follow demand that already existed in a narrow market. Observing the project does not show that it created a new broad opportunity. The entrant still needs evidence of the actual unmet job and its willingness to pay.
Japan's investment figures are not a mirage. They describe growing direct-investment positions and substantial greenfield activity. The mistake is architectural: placing them where customer evidence should go. Large assets can change the ground beneath a business. They do not automatically create the path from that ground to a buyer.
Evidence
Sources
- JETRO Invest Japan Report 2025Japan External Trade Organization · December 26, 2025
- Balance of Payments, Calendar Year 2024 preliminary figuresMinistry of Finance Japan · February 10, 2025
- International Investment Position of Japan (End of 2024)Ministry of Finance Japan · May 27, 2025
- International Investment Position of Japan: End of 2024 annually revised figuresBank of Japan · May 26, 2026