Tourism and Demand
Japan's inbound-spend record was mostly a volume story.
By Japan Legible
- Published
- Last checked
- Reading time
- 9 minutes

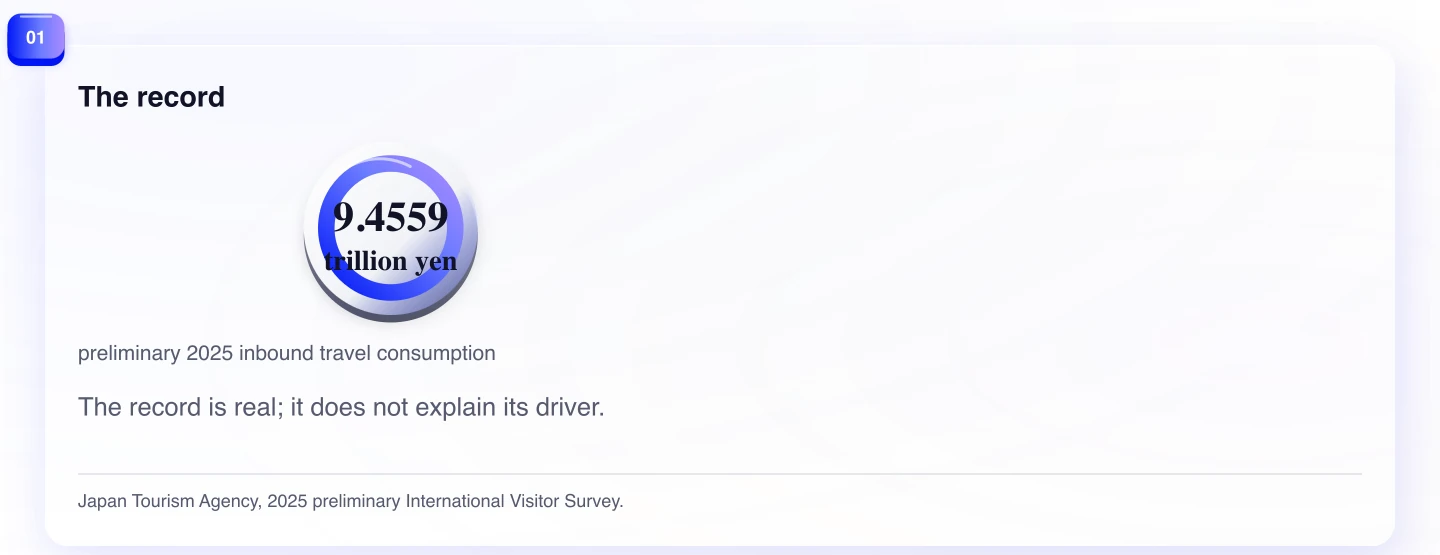
Japan's preliminary 2025 inbound travel-spend total reached 9.4559 trillion yen, a record and a 16.4 percent rise from the previous year. That headline can sound like proof that Japan is earning much more from each visitor. The agency's own average tells a quieter story: all-purpose spend per visitor was 229,000 yen, only 0.9 percent higher. The record was principally a volume result.
That distinction matters to overseas hotel groups, retailers, attractions, and consumer brands that treat inbound tourism as a demand signal. A market where the average ticket is climbing quickly calls for a different response from a market where many more people are arriving. The first may put price architecture and premium conversion at the center. The second puts capacity, availability, service, inventory, and handoffs at the center.
Neither reading should become a stereotype. The national data does not say that every visitor, city, category, or company saw the same change. It does say that a large national total is not, by itself, evidence of a national premium-spend surge. For 2025, the magnitude of the visitor increase is the more useful starting point.
The record is real. The explanation needs two numbers.
The Japan Tourism Agency's preliminary estimate puts international visitor travel consumption at 9.4559 trillion yen in calendar year 2025. That is a record and 16.4 percent above 2024. A business with exposure to visitor demand should not minimize the scale of that signal.
The agency also reports an all-purpose spending figure per visitor: 229,000 yen, up 0.9 percent year on year. The 2024 result was 226,851 yen. In other words, average reported spend rose, but only modestly compared with the total.
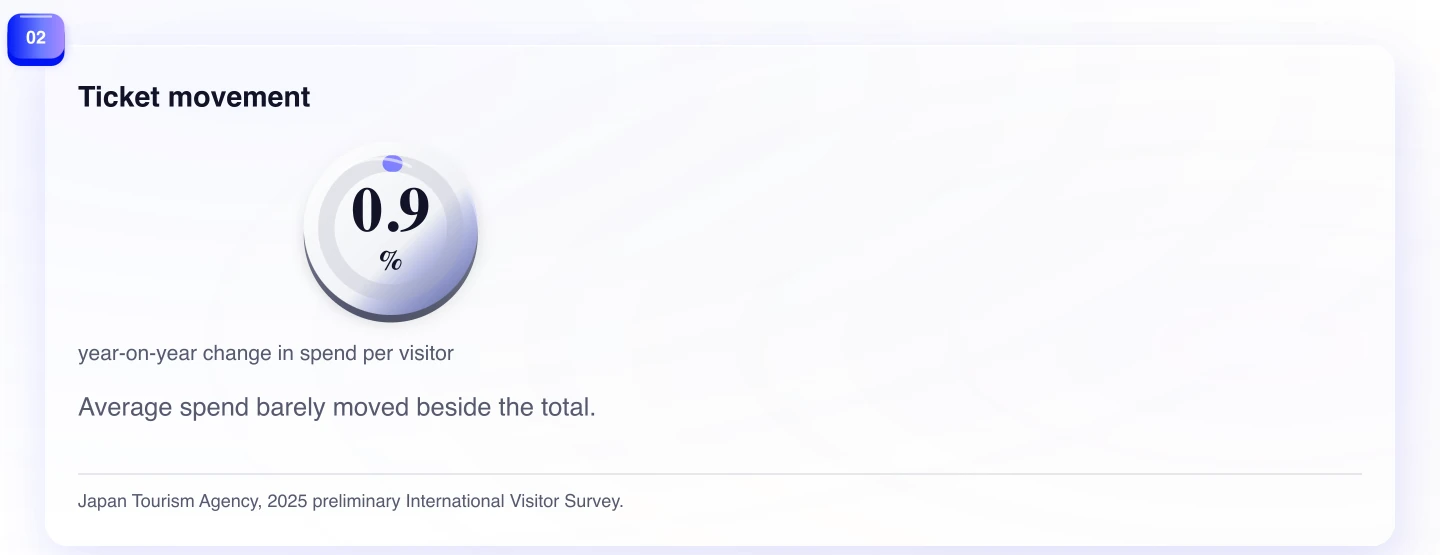
The tension is productive. A total can grow rapidly while an average barely moves if the number of people grows rapidly. This is not an abstract accounting point. It changes which commercial bottleneck is most likely to matter. More visitor flow can make the next unavailable room, long queue, missing payment option, unclear route, or out-of-stock item more consequential than the next premium package.
The arrival series gives the total its scale
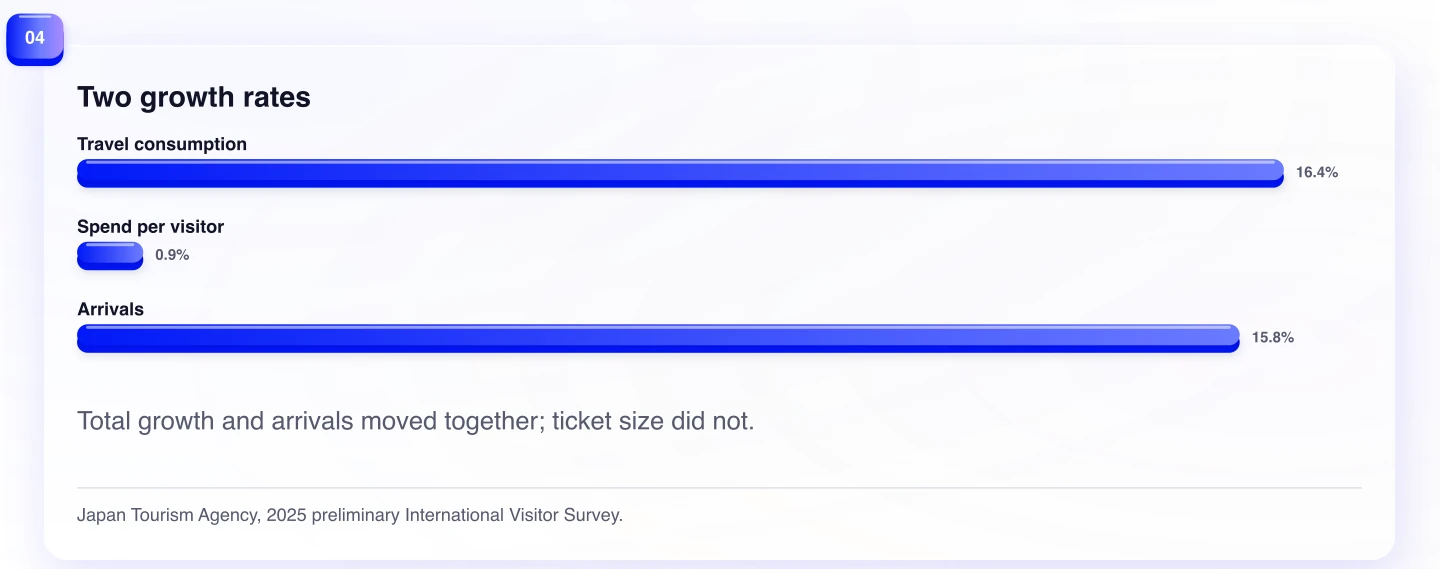
JNTO estimated 42,683,600 visitor arrivals in 2025, up 15.8 percent from 36,870,148 in 2024. It called the annual figure a record. The arrival increase is close to the 16.4 percent increase in travel consumption; the per-visitor measure rose by less than one percent.
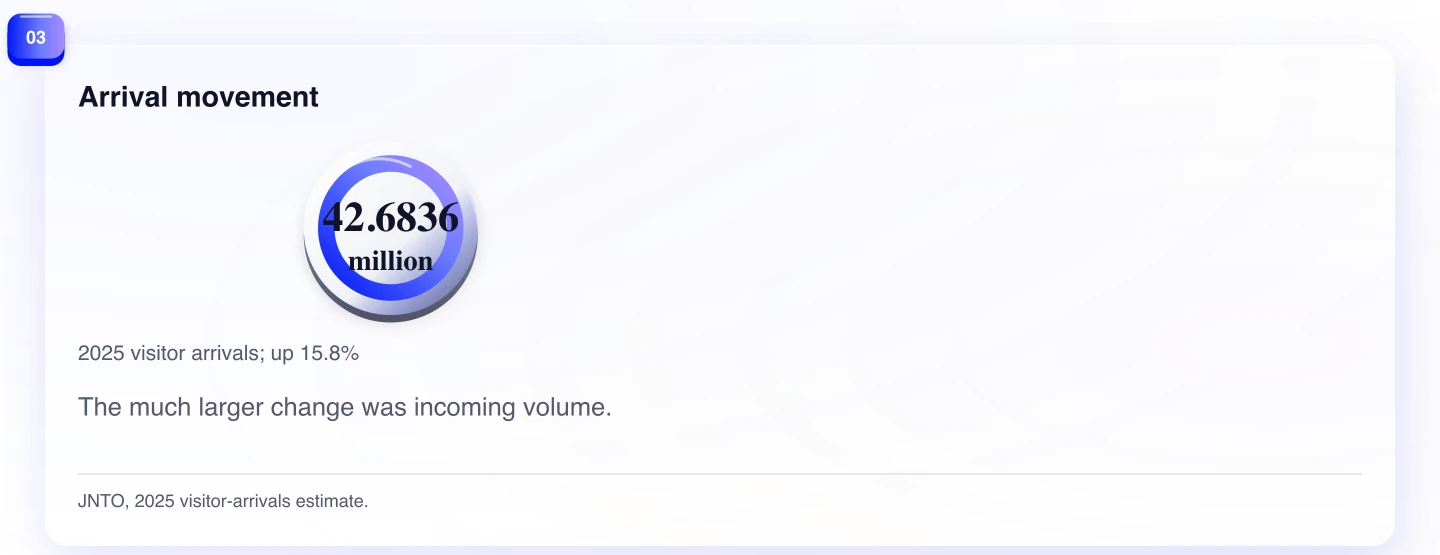
The figures do not prove a single causal chain. They do support a disciplined interpretation: the national spending record was driven much more by increased volume than by increased reported spend per visitor. That is the thesis of this article, and it is deliberately narrower than saying that price, exchange rates, destination mix, or category mix did not matter.
The word “arrivals” deserves care. JNTO derives the series from immigration statistics. Its definition can include expatriates, their families, and students, and it excludes crew. It is a valuable volume indicator, not a count of unique leisure tourists or a customer list for a particular business. The label is part of the evidence, not a footnote to discard.
For an operator, more arrivals generally mean more possible transactions. They also mean a higher chance that basic execution determines whether demand turns into revenue. That is why a volume interpretation is not less commercially interesting than a premium interpretation. It changes the job.
What the tourism survey measures
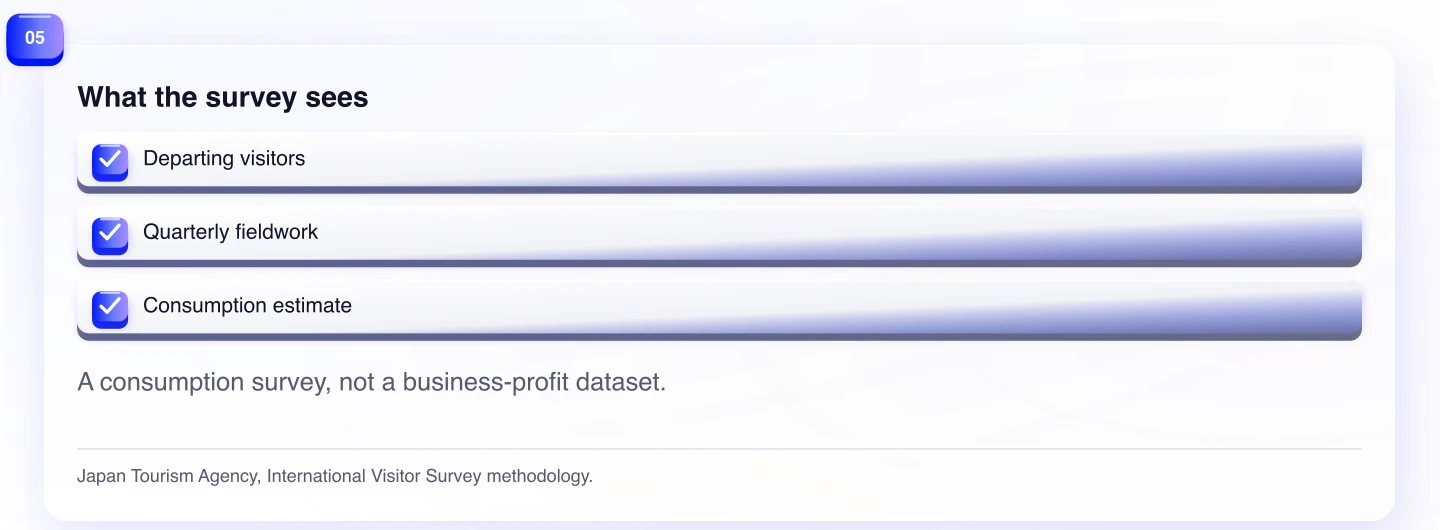
The Japan Tourism Agency's International Visitor Survey estimates consumption by international visitors. Its national survey covers departing international visitors at 17 air and sea ports. It excludes transit passengers, crew members, and people who have stayed in Japan for a year or more, and it runs quarterly.
That method explains both the value and the limit of the result. It gives a national estimate of travel consumption and a reported spend-per-visitor measure. It does not reveal the margin of a particular restaurant, the conversion rate of a shop, the effect of a staffing decision, or the repeat behavior of a foreign brand's customer.
The result is also preliminary. The agency says it releases final annual aggregates at the end of March in the following year, so the January 2026 calendar-year estimate should retain its preliminary label. A planning team can use it as a current signal, then check the final result before using it as a fixed baseline for a long-lived forecast.
Methodology is not a reason to stop thinking. It is a reason to make the claim fit the measure. The 16.4 percent total increase, 0.9 percent per-visitor increase, and 15.8 percent arrivals increase form a strong pattern. The precise distribution of benefit within that pattern remains a local question.
More visitors change the operating job
A company that sees “9.4559 trillion yen” and immediately adds a luxury upsell may be right for its location. The number alone has not told it that. The first question is more concrete: where does the added flow encounter friction?
For a hotel, the answer may be reservation clarity, check-in capacity, payment, or the information guests need after booking. For an attraction, it may be timed entry, language support, wayfinding, and the ability to manage a fuller day without a worse experience. For a retailer, it may be shelf availability, easy product explanation, tax-free processes where relevant, or a way for the visitor to find the product again after leaving the area.
These examples are not causes established by the survey. They are operating hypotheses that a volume-led signal makes worth testing. A national travel-spend figure should prompt a team to look for where demand is being lost, not to invent a story about why every visitor buys.
The same logic applies to marketing. More visitor traffic does not imply that a new high-price campaign is the best first move. A concise, findable offer can sometimes capture more of the existing flow. A useful local dashboard separates exposure from conversion: how many likely visitors reached the page, storefront, or venue; what stopped them; what they bought; and what it cost to serve them.
Do not turn different series into a homemade metric
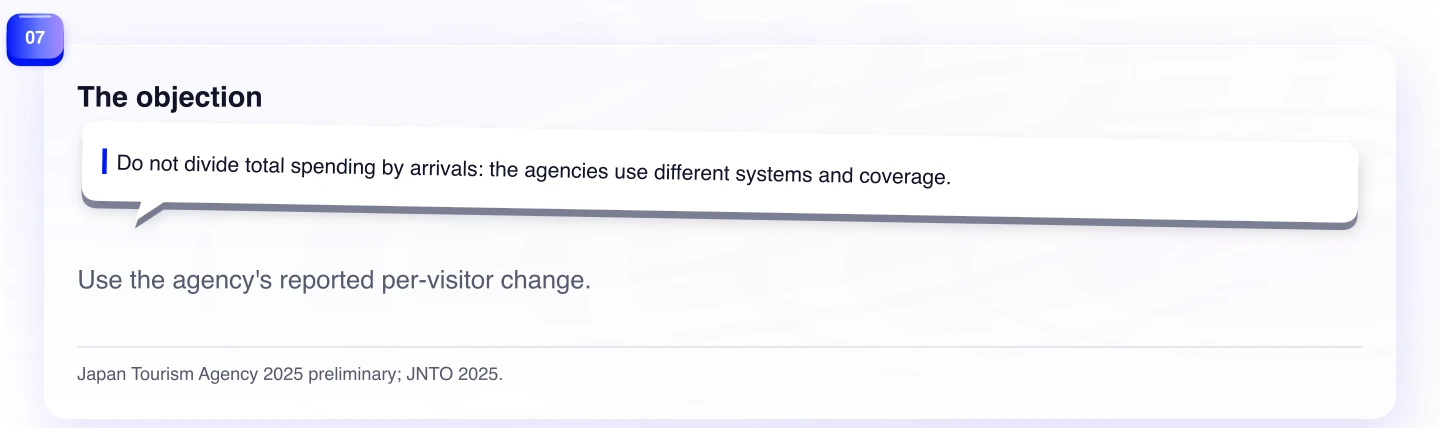
The strongest objection to this analysis is methodological. The Japan Tourism Agency's consumption result and JNTO's arrivals series come from different systems with different coverage. A quick division of total spending by annual arrivals would produce a number, but not necessarily a valid spend-per-person measure. The agencies have already published the more relevant measure: the survey's all-purpose spend per visitor.
That objection narrows the argument without eliminating it. The article does not depend on a homemade ratio. The official survey says per-visitor spend rose 0.9 percent. JNTO says arrivals rose 15.8 percent. The tourism agency says total travel consumption rose 16.4 percent. The available evidence is therefore much more consistent with a volume-led record than with one chiefly driven by ticket size.
There can still be segments where spend rose sharply. A national average cannot rule that out. It also cannot prove that a foreign retailer's customer will behave like that average. The appropriate move is to segment the local data rather than claim certainty from an aggregate.
What remains unknown is your economics
The official sources do not identify a hotel's incremental profit, a shop's stockout rate, an attraction's queue cost, or a category's share of a particular visitor budget. They do not show which mix of markets reached a property, whether a product was discovered before or during the trip, or what effect a particular exchange rate, campaign, or service adjustment had on the result.
Those unknowns are where a market-entry or growth test begins. Track visitor exposure separately from conversion. Record whether demand is lost because of capacity, language, payment, inventory, or uncertainty. Compare basket and margin with domestic demand without assuming the groups are interchangeable. Test premium offers where the local evidence says they remove a real constraint.
Japan's 2025 inbound-spend record matters. Its composition matters more for a decision. The larger flow explains more of the record than a larger average ticket. Build first for the visitors who are already arriving, then earn a premium thesis in the place where the transaction actually happens.
Turn the national signal into a local test
A useful first test does not need to predict the whole visitor economy. It needs to make the volume hypothesis operational. Pick one point in the journey where additional flow could be lost: a reservation page, a queue, a shelf, a payment screen, a customer-service handoff, or the moment after a purchase when a visitor tries to find the product again. Establish a baseline, change one condition, and compare conversion, service time, basket, and margin.
This approach has a second advantage. It does not ask the team to choose between serving visitors and serving domestic customers. The operational improvements that make a fuller day easier to navigate can also reduce friction for local customers. Where there is a trade-off, the data can make it explicit: a visitor-facing translation may improve discovery but add service time; a reservation rule may protect capacity but reduce walk-in sales. The national figures cannot settle those choices, but they tell a team why they deserve measurement.
It is equally important to use the right comparison period. A record annual total can hide sharp seasonal or location-level differences. Keep the national statistic as context and compare the local result with a relevant week, season, and operating constraint. The question is not whether the business captured a share of 9.4559 trillion yen. The question is whether it served the next increment of demand profitably and without weakening the experience that brought people there.
That is the practical reading of a volume-led record. Do not downgrade the opportunity because average spend was nearly flat. Do not upgrade every offer because the total was historic. Treat the flow as real, make the constraint visible, and decide from the transaction rather than the headline.
Evidence
Sources
- International Visitor Survey: Calendar Year 2025 preliminary resultsJapan Tourism Agency · January 21, 2026
- Visitor arrivals, December 2025 estimateJapan National Tourism Organization · January 21, 2026
- International Visitor Survey: overview and methodologyJapan Tourism Agency
- International Visitor Survey: Calendar Year 2024Japan Tourism Agency