Commerce and Infrastructure
B2B digitized faster than consumer commerce.
By Japan Legible
- Published
- Last checked
- Reading time
- 9 minutes

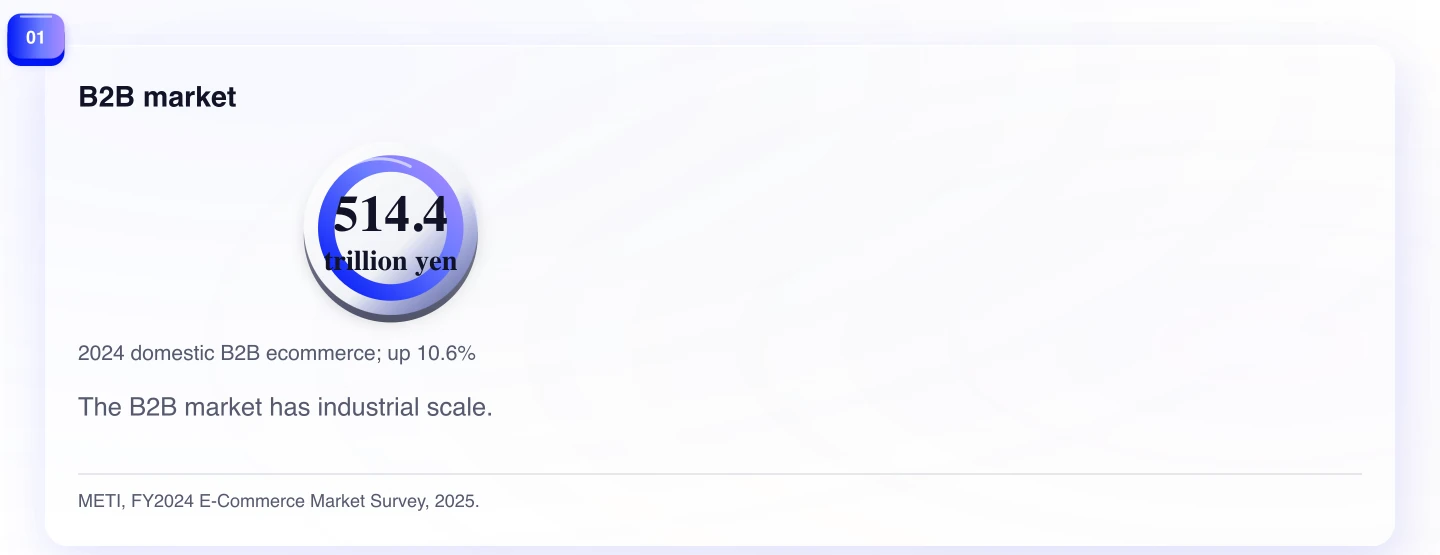
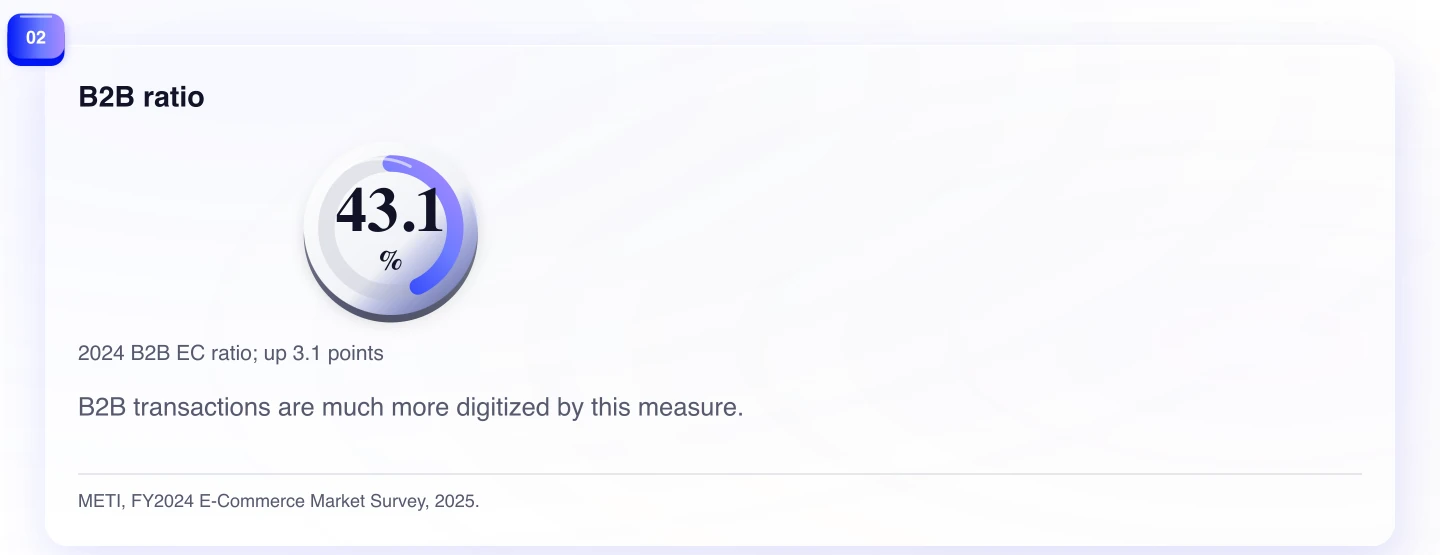
Japan can look like two different digital-commerce markets at once. METI estimated domestic B2B ecommerce at 514.4 trillion yen in 2024 and put the B2B EC ratio at 43.1 percent. Its B2C merchandise EC ratio was 9.8 percent. The numbers do not contradict each other. They say that digital-commerce maturity depends on which side of the transaction a company is selling into.
That difference is useful precisely because it resists a generic answer to “Is Japan online?” An industrial platform, procurement tool, or B2B software product enters a different commercial terrain from a consumer-merchandise brand. One country can contain both a deeply digitized business-transaction layer and a consumer-merchandise market where final online transactions account for a much smaller share of the relevant measure.
The practical error is to borrow the consumer conclusion for a B2B launch, or the B2B conclusion for a consumer launch. A high ratio does not eliminate workflow questions. A lower ratio does not establish that customers are unready for digital discovery. The data changes the starting hypothesis, not the need for product research.
One country, two commerce stories
METI estimated the domestic B2B ecommerce market at 514.4 trillion yen in 2024, up 10.6 percent from the previous year. It put the B2B EC ratio at 43.1 percent, a 3.1-percentage-point increase.
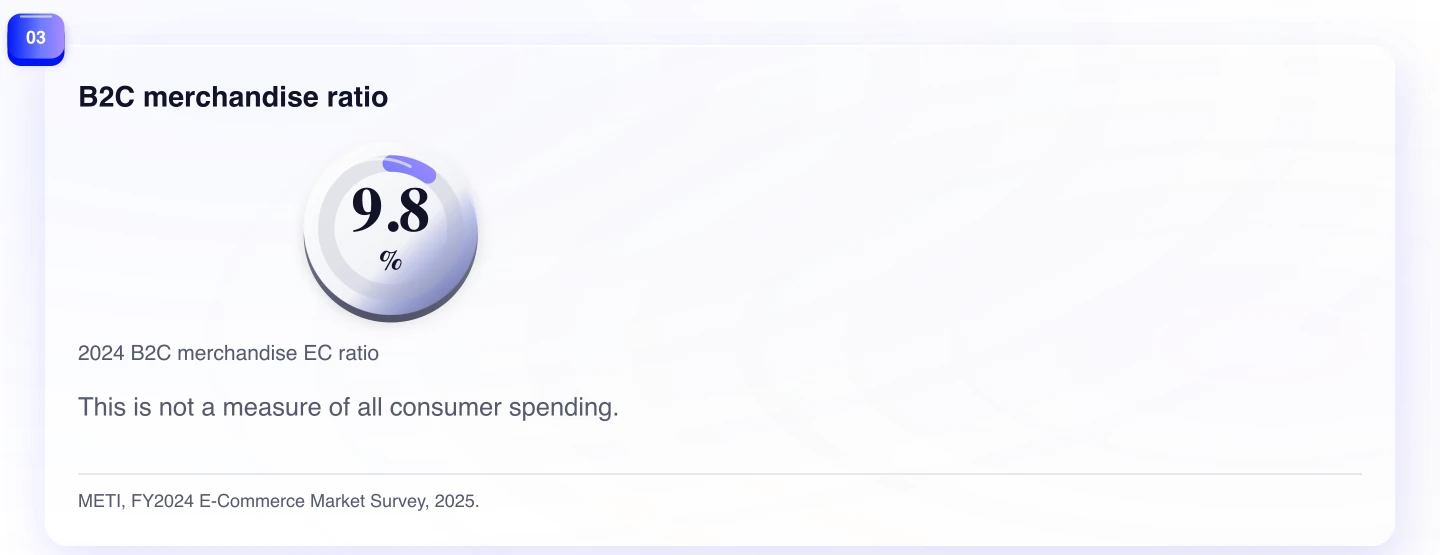
The B2C merchandise EC ratio was 9.8 percent, up 0.4 percentage points from 2023. The difference between 43.1 percent and 9.8 percent is the article's central signal. The transaction side changes the reading of market maturity.
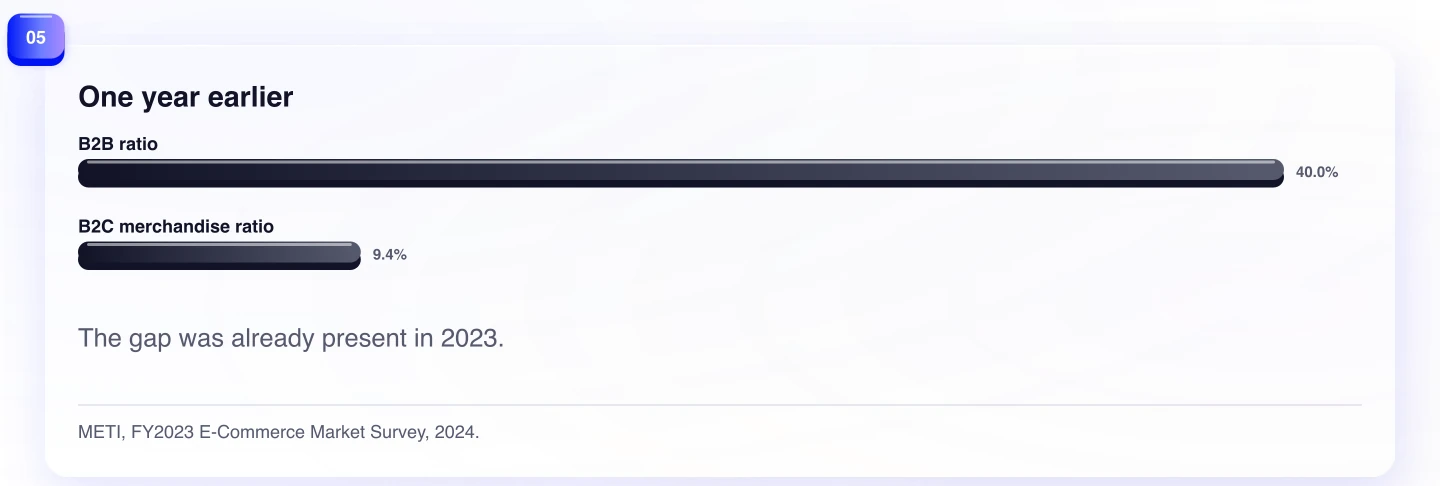
A useful comparison with METI's FY2023 results shows that this is not a one-year accident. The agency reported a 40.0 percent B2B EC ratio in 2023 and a 9.38 percent B2C merchandise ratio. Both measures rose in 2024, but the gap remained substantial.
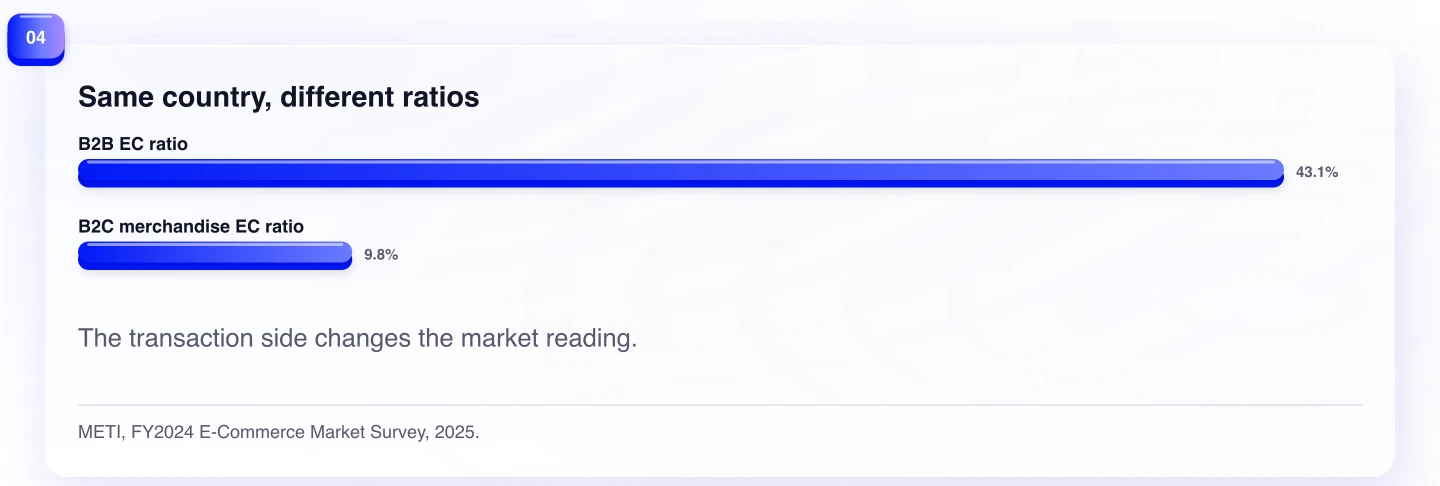
The market values deserve labels as carefully as the ratios. The 514.4 trillion yen figure is a domestic B2B ecommerce estimate. The 9.8 percent figure is a B2C merchandise-sector EC ratio. Combining them in one sentence without the labels produces a dramatic contrast, but not a valid like-for-like comparison. Their value lies in the contrast of their scopes.
The consumer ratio is narrower than it sounds
The most common misuse of the 9.8 percent figure is to call it ecommerce's share of all consumer spending. METI's B2C market total includes merchandise, services, and digital transactions. The EC ratio calculation for B2C is limited to the merchandise sector.
That limitation does not make the ratio unhelpful. It makes it directly relevant to a company selling physical consumer goods. It also tells a company selling travel, financial services, games, or another service or digital offer not to borrow the merchandise conclusion. The definition is the decision rule.
The ratio also does not reconstruct a customer's journey. A customer can discover a product online, compare it digitally, ask a question in a physical setting, and complete a transaction through a channel the ratio does or does not classify as ecommerce. The statistic describes the final transaction value in a defined market. It does not capture every influence on that transaction.
B2B maturity changes the first question
For a B2B seller, the 43.1 percent figure should move the opening question away from “Will Japanese companies transact digitally?” and toward “What part of the workflow must this product fit?” A buyer may already be comfortable with electronic ordering, data exchange, or digital invoicing and still reject a product that does not fit approval rules, existing systems, implementation responsibilities, or account ownership.
That is not a claim that every B2B process is modern, interoperable, or easy to enter. The EC ratio cannot show those details. It is a national indicator that a large share of the defined B2B transaction value is electronic. A serious entry plan has to locate the actual workflow: who recognizes the need, who approves it, what data moves, who owns the budget, and what happens after the order.
The distinction is particularly useful for overseas software teams. A consumer-style storefront can be a poor proxy for a B2B entry motion. The commercial proof may be an integration, a procurement route, an operational owner, or a local support commitment. The aggregate statistic cannot choose those elements. It can prevent a team from assuming that a low consumer-merchandise ratio describes the whole economy.
Consumer commerce needs a different inquiry
For a consumer-merchandise seller, the 9.8 percent ratio points to a different research agenda. Category structure, discovery, physical reassurance, delivery, returns, retail partners, and local service can all matter. The figure is not permission to say that every category is mostly offline or that a direct online launch will fail. It is a reason not to use national online-market scale as a substitute for channel design.
A consumer brand should ask where confidence is produced for its category. Sometimes a product page and delivery promise are sufficient. Sometimes trial, fit, service, or a trusted intermediary is part of the sale. The official statistics do not establish the reason for any one channel choice. They show that the B2C merchandise side and the B2B side should not be entered with the same assumption about transaction digitization.
The objection: ratios are not customer experience scores
The strongest objection is straightforward: the two ratios use different sectors and transaction contexts. They do not prove that business buyers are more digitally capable, that consumers prefer offline channels, or that a particular buyer's experience is digital. The objection is correct.
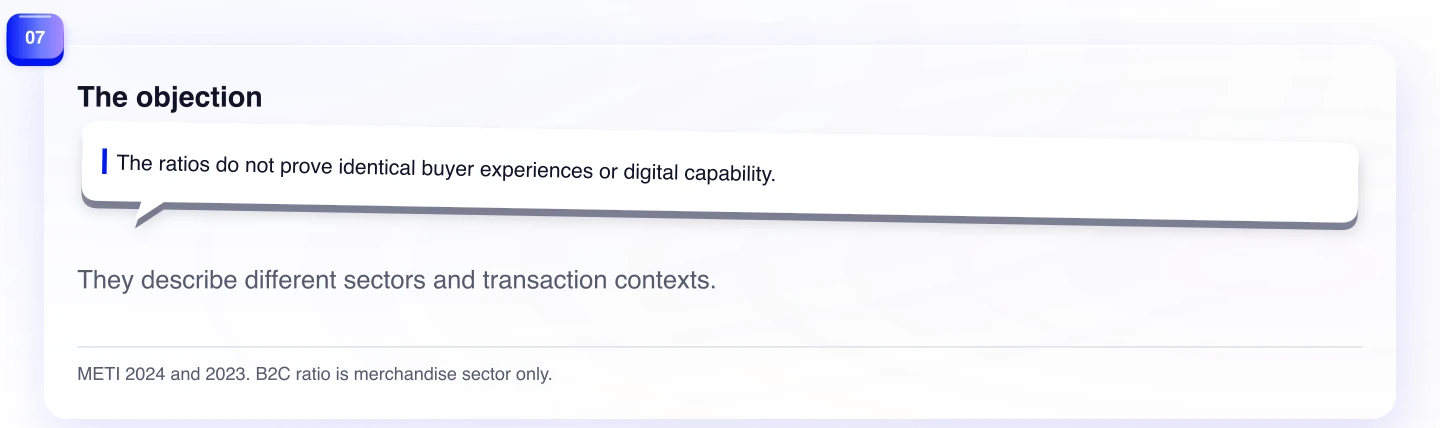
It does not erase the comparative insight. The objective is not to rank Japanese buyers. It is to choose the appropriate first question. B2B and B2C merchandise have different measured penetration levels, different market definitions, and likely different commercial jobs. Treating them as one “Japan ecommerce” condition makes both entry plans worse.
METI has run its ecommerce market survey since fiscal 1998, covering market size, EC ratios, and use by businesses and consumers. That longevity supports using the series carefully as a structural signal. It does not extend its claims beyond the definitions in the report.
What the national measure cannot decide
The official sources do not show a specific seller's procurement workflow, sales cycle, customer-acquisition cost, integration need, approval path, or reason for a buyer's channel preference. They cannot tell an overseas company whether a marketplace, direct sales force, distributor, partner, or local site will be the efficient route.
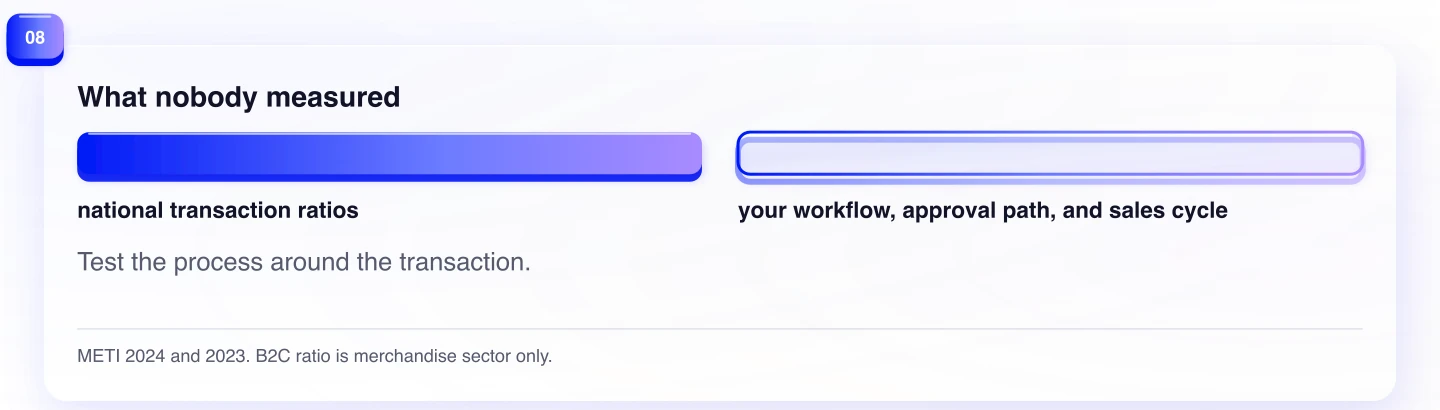
Those unknowns define the first test. A B2B seller can map the workflow around the transaction and test the responsibility points that stop approval. A consumer seller can map the journey around the transaction and test what produces enough confidence to buy. Keep the evidence separate until the product has earned a connection between them.
Japan did not digitize all commerce at one speed. METI's 2024 figures show B2B much further along by its EC-ratio measure than consumer merchandise. The better entry plan begins with the transaction side, then tests the workflow or journey that the national statistic cannot see.
Build the first experiment around the right unit
For B2B, the unit is often not a webpage visit. It may be an order, a data exchange, an approval, a billing event, or a handoff between a buyer and an operational team. A useful pilot names that unit before it chooses a feature list. Measure how long the current step takes, who owns it, what data is missing, and what exception causes the process to leave the electronic route. The national ratio makes workflow a sensible starting point; the pilot determines whether the product fits it.
For consumer merchandise, the unit is usually a customer journey with several channel moments. Measure discovery, product understanding, confidence, delivery, returns, and repeat purchasing separately. A physical touchpoint can help with one of those jobs without being the channel where the final order is recorded. The B2C merchandise ratio is therefore a reason to map the journey carefully, not a reason to declare online selling insufficient.
Both routes benefit from the same discipline: distinguish a market signal from a go-to-market conclusion. The difference is the hypothesis each team brings to the first experiment. A B2B team should look for compatibility with a commercial workflow. A consumer-merchandise team should look for the point where the buyer needs confidence that a page alone may not supply.
That framing also improves internal conversations. Instead of debating whether Japan is digitally mature, a team can ask a question that has an answer: which transaction, which actor, which step, and which evidence would make the next investment rational? METI's figures do not answer those questions. They make clear why the B2B and B2C versions should not be the same.
The result is a more useful brief. It names the market measure, its boundary, the workflow or journey to inspect, and the smallest decision the first test must support. That is enough structure to begin without pretending that a national ratio can specify a sales motion.
It also keeps the next conversation practical. The B2B team can decide whether it solves a workflow problem; the consumer team can decide whether it removes a confidence gap. Neither needs to inherit the other's metric.
Evidence
Sources
- Results of FY2024 E-Commerce Market Survey CompiledMinistry of Economy · August 26, 2025
- FY2024 E-Commerce Market Survey ReportMinistry of Economy · August 26, 2025
- Results of FY2023 E-Commerce Market Survey CompiledMinistry of Economy · September 25, 2024
- E-Commerce Market SurveyMinistry of Economy